What Trucking Tonnage Tells Us About Market Crashes and Recessions
I was recently asked if a market crash can trigger a recession. In short: yes, it certainly can—and it did in the early 2000s.
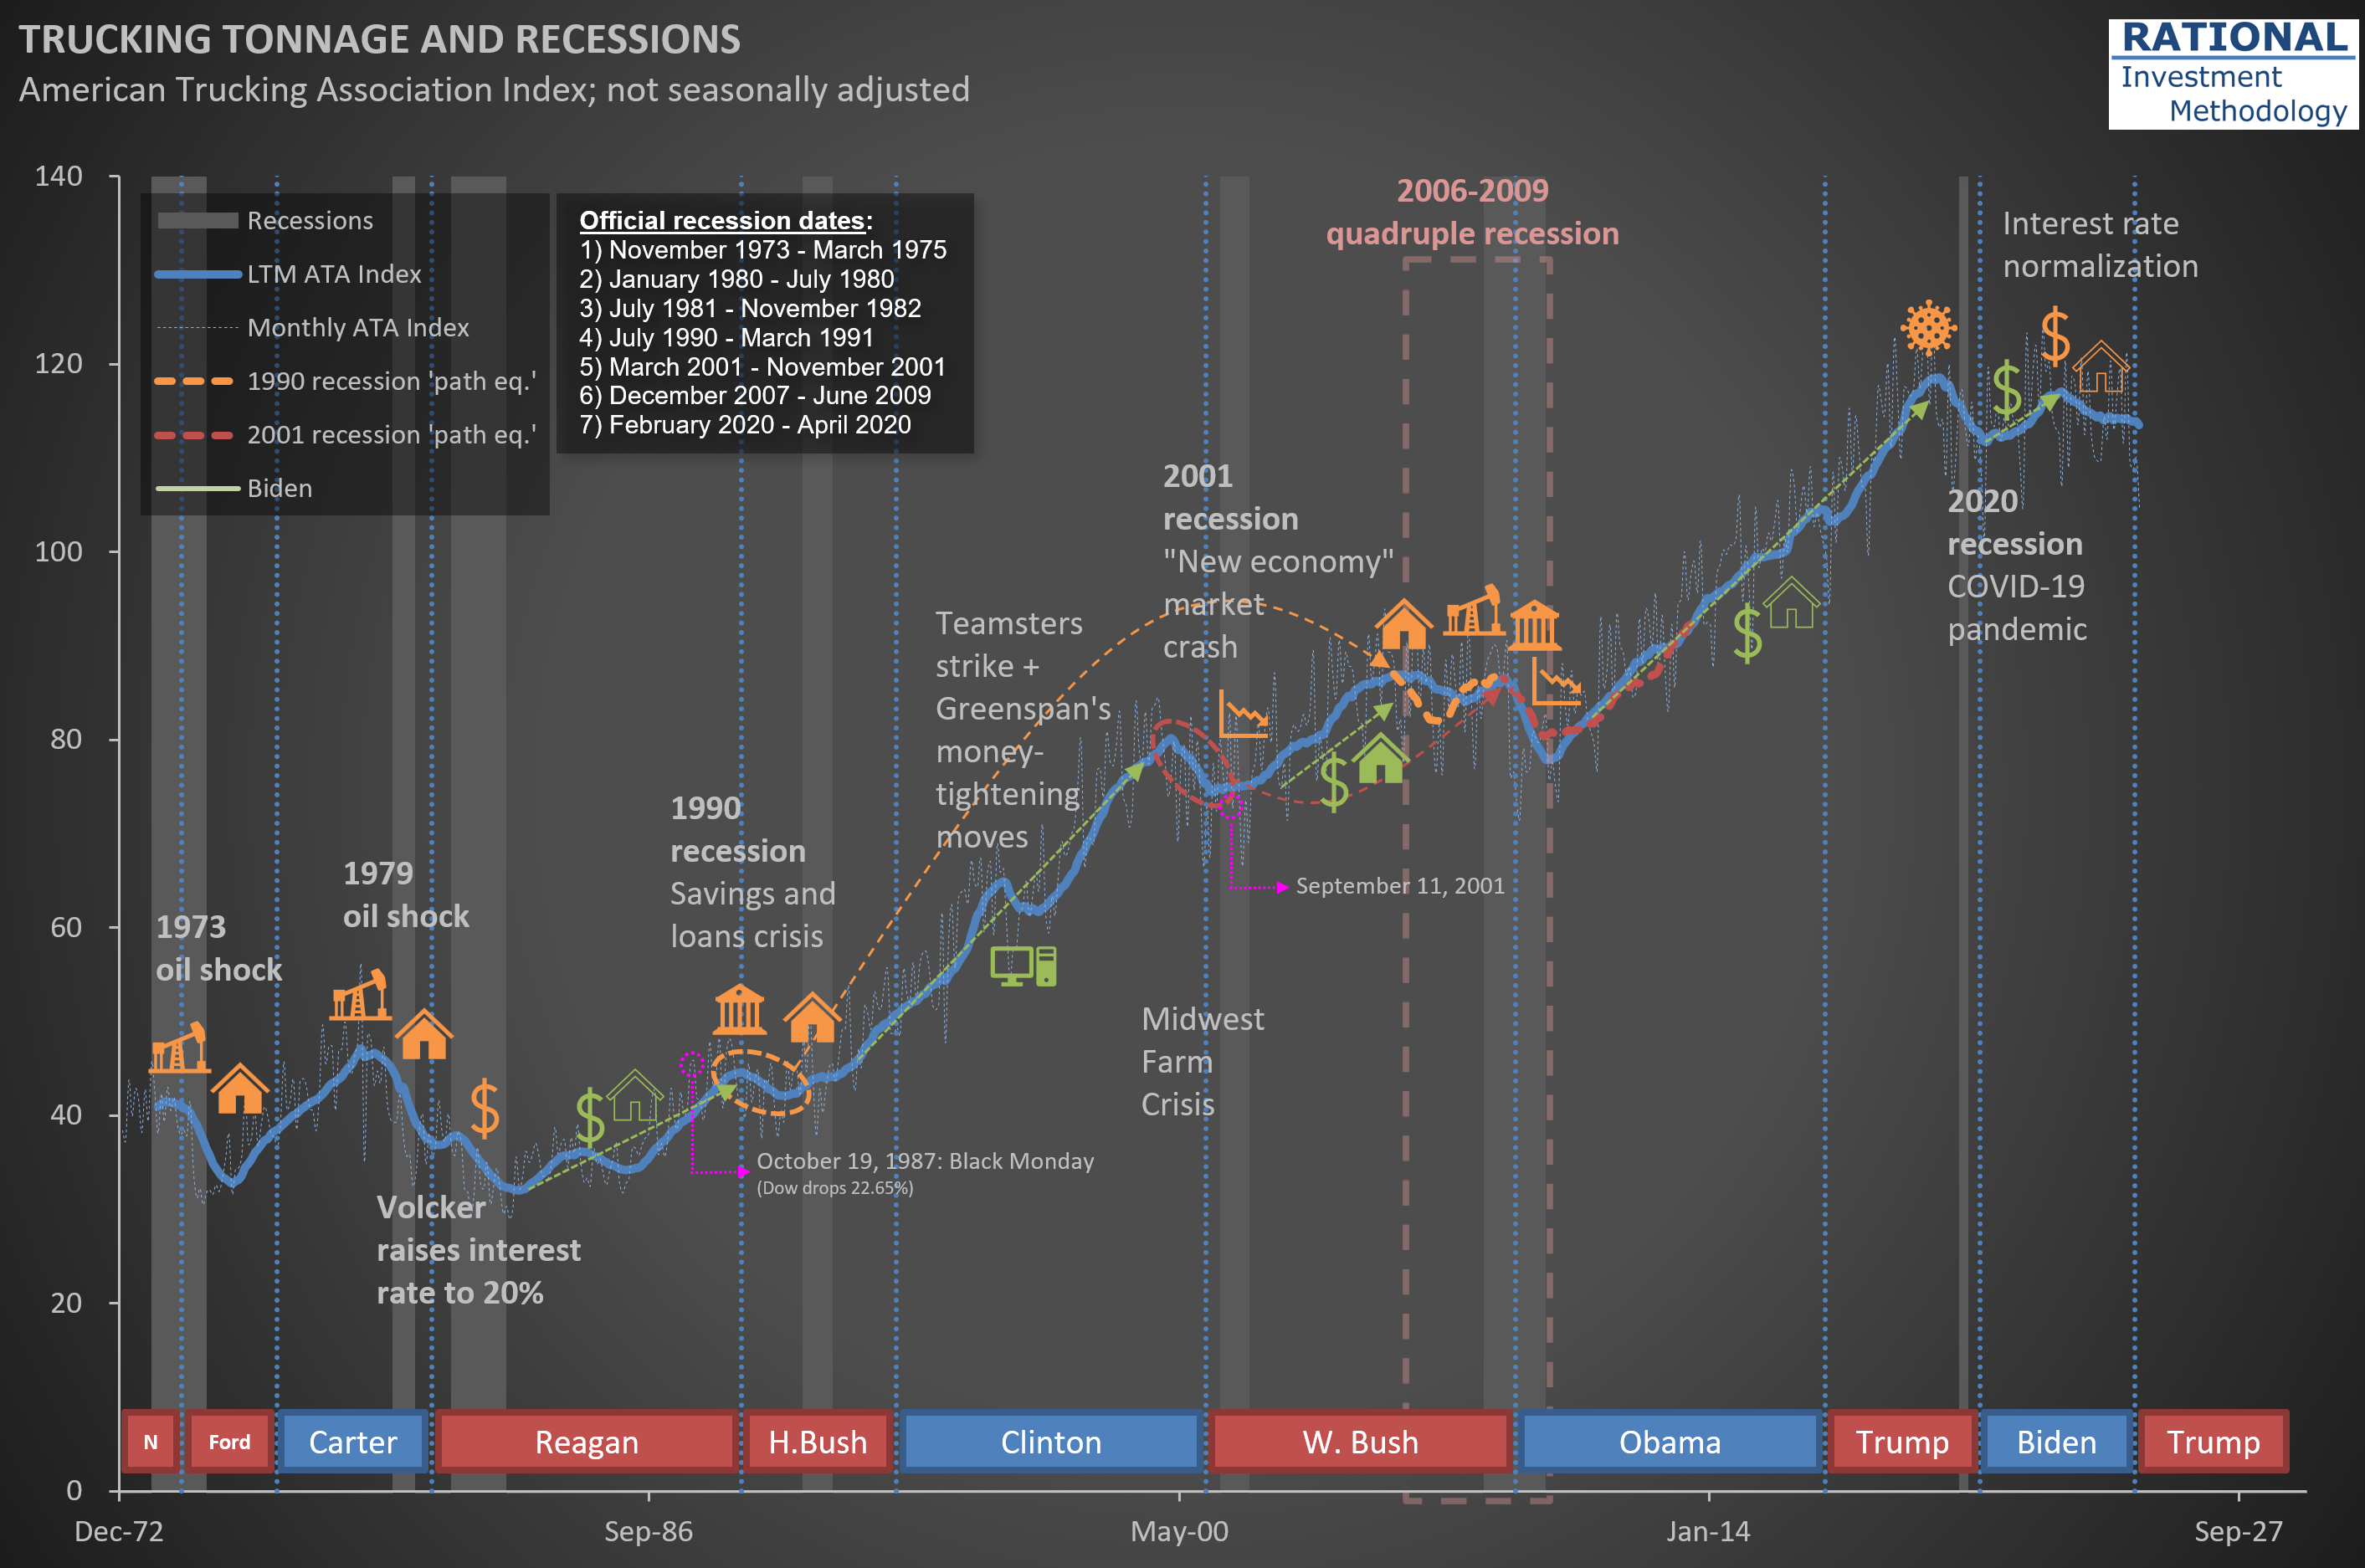
The chart below should look familiar to RIM’s clients. It shows trucking tonnage data from the ATA (American Trucking Association). The thin-dotted blue line represents monthly figures, which tend to be volatile due to weather seasons and holidays. I’ve added a thick blue line showing the Last Twelve Months (LTM) moving average to better identify trends.
Every turn in this LTM line has a story behind it—economies typically grow until something disrupts them. That’s why you’ll see annotations on the chart marking significant events: sharp oil price spikes, declines in housing starts, rising interest rates, banking crises, market crashes, and even a global pandemic (I never imagined I’d be adding that one!).
Take a closer look at the early 2000s. Trucking tonnage began declining around March 2000—exactly 25 years ago—coinciding with the internet bubble bursting. While the tragic events of September 11th certainly disrupted economic activity further, the downturn had already begun well before then. However, the market crash was clearly the initial trigger.
Could we be experiencing something similar today? Nobody knows, but there’s no point obsessing over it. Unless, of course, you invest in companies for which it is challenging—if not impossible—to predict long-term sales and profitability. These types of companies are the core protagonists—in terms of how much they decline—during bubble bursting years.
As equity investors, our focus should remain on thoroughly understanding a select group of companies and accurately modeling their financials based on company- and industry-specific data. Then, when the market inevitably overreacts to short-term news or temporary EPS fluctuations, we’re ready to act decisively. If you’ve been following RIM’s approach, you know that’s exactly what I do every single day.
