When Costs Surge: Units Impact and Counterintuitive Profitability Outcomes
To provide additional context for the Portfolio Action [PA]* I recently shared with RIM clients, I wanted to explore a counterintuitive example of how a company’s operating profit can be impacted when (i) there is a sudden increase in Cost of Goods Sold (COGS) and (ii) customer budgets remain unchanged in USD terms. For reference, you can find the link to the PA here.
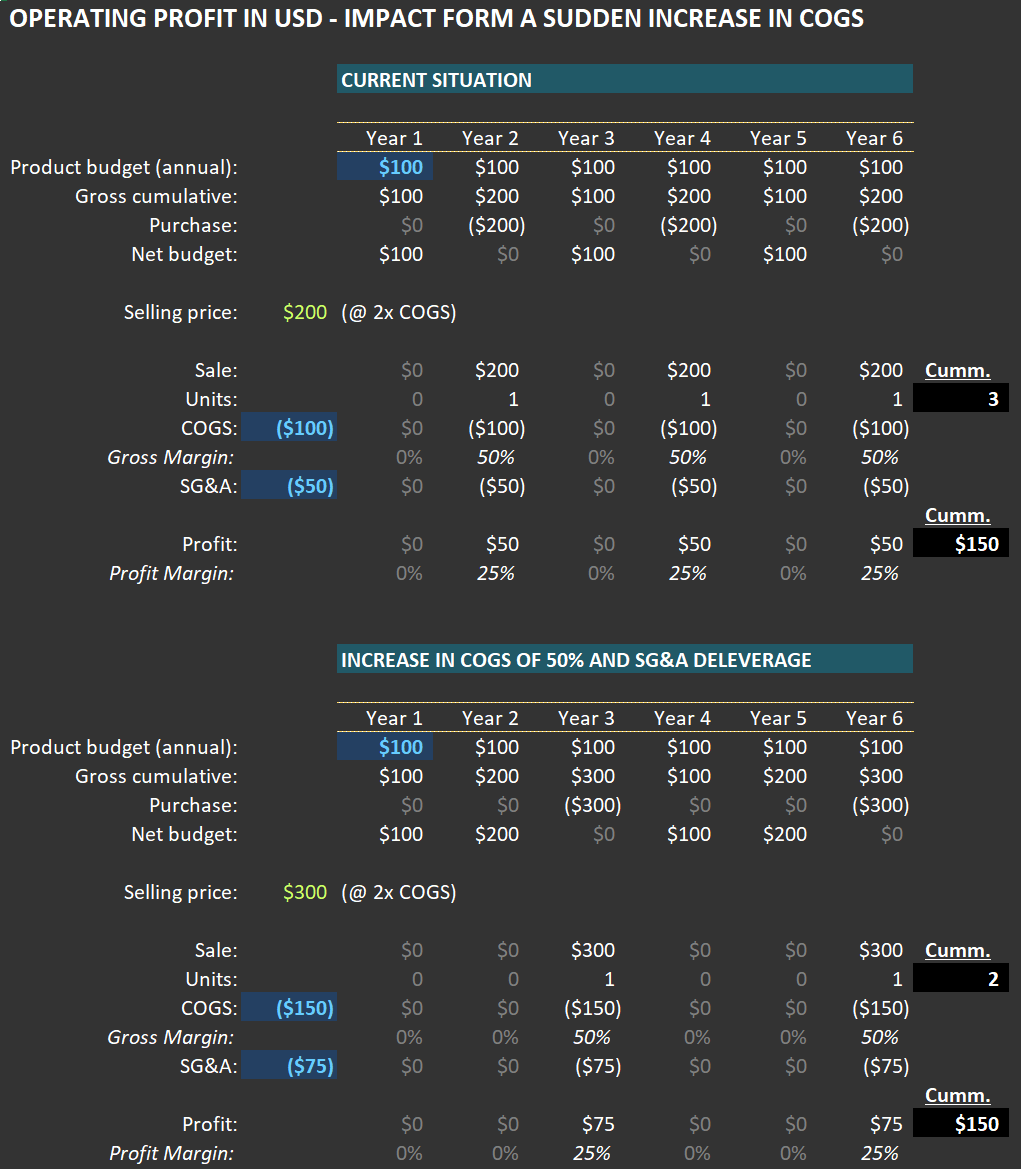
Below, you’ll find two tables illustrating this concept. The first table outlines the economics of a company selling a specific product (let’s use tennis shoes as an example). The second table shows the scenario after the company experiences a sudden increase in COGS, perhaps due to an import tariff hike.
In the initial case, customers allocate $100 per year for tennis shoes. Each pair costs $200 because the seller applies a 100% markup—buying the shoes for $100 and selling them for $200. This means customers purchase one pair every two years. As shown in the first table, the company generates $50 in operating profit per pair sold.
Now let’s examine the second case: COGS rises from $100 to $150 per pair. If the company maintains its standard markup, the selling price increases to $300 per pair. A quick note on this practice: many companies I follow are remarkably disciplined about preserving gross margins during significant COGS fluctuations, passing on these costs to consumers.
What happens to purchase frequency? If customers stick to their $100-per-year budget (a key assumption since sticker shock could alter behavior), they will now buy a pair every three years instead of every two. Despite this reduced frequency, operating profit per unit could still rise—even with SG&A (Sales, General & Administrative expenses) increasing from $50 to $75 per unit in this scenario. In fact, as shown in the second table, operating profit grows to $75 per unit.
Over six years, when both cases complete their respective cycles, here’s what we observe: In the first case, three units are sold, generating $150 in total operating profit. In the second case, only two units are sold—but total operating profit remains identical at $150. This phenomenon, where absolute USD profits stay consistent despite lower unit sales, often surprises me—and I’ve seen it play out multiple times in real-world scenarios.
The key takeaway here—especially relevant to the PA concerning a transportation company—is that a sudden rise in tariffs typically leads to reduced volumes for products affected by higher COGS and selling prices.
From there, several financial dynamics come into play. For example:
Will typical customers maintain their annual budgets? If their income is negatively impacted, budgets may shrink.
If the product is essential and purchased regularly, budgets might even increase over time in USD terms—potentially boosting profits for sellers.
On the other hand, demand for non-essential products could decline significantly.
In some cases, companies might switch to sourcing locally produced goods. While unlikely for tennis shoes, this scenario could apply to industrial products made with heavy automation where local production costs are competitive with international suppliers. In such cases, neither companies nor customers would experience significant changes.
One thing is certain: a sudden increase in COGS creates shockwaves. Given the potential magnitude of current cost pressures, volume dislocation risks are high—and these effects will not be evenly distributed across companies or industries. This underscores why fundamental analysis remains critical for understanding how these dynamics will impact specific businesses.
For further insights related to this example and its connection to our PA, please refer back to that communication.
(*) A PA is a message sent to RIM clients whenever a position enters or exits our portfolio.
