Why “Simple” Numbers Lie: Lessons from $FDX and the Art of Financial Analysis
Why do I devote so much effort to detailed financial analysis of the companies in RIM’s CofC(*)? It’s because companies are constantly evolving, and off-the-shelf calculations like “sales growth” or “margin trends” frequently become meaningless in the real world.
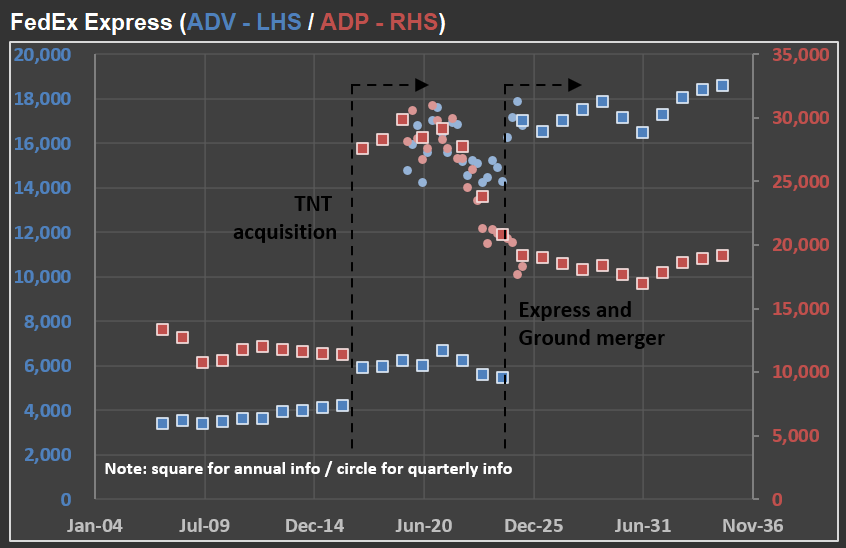
Take $FDX (FedEx) as an example. In the picture below, you’ll see how FedEx has reported ADV (Average Daily Volume) and ADP (Average Daily Packages) for their Express segment over the last 20 years, along with “base case scenario” forecasts for the coming decade.
First, notice the significant jump in ADP in 2017. That spike came right after the acquisition of TNT Express—a major European operator. The timing, however, was unfortunate: only months later, FedEx was hit by the NotPetya ransomware attack, which severely impacted TNT’s IT systems. Nearly every hub, facility, and depot had to have its systems rebuilt from scratch. The recovery was extensive, and FedEx estimated immediate losses of at least $300 million due to reduced shipping volumes, lost revenue, and higher remediation costs.
Fast-forward to recent years, and the numbers became complicated again. FedEx has merged its Ground and Express segments, moving closer to the model used by UPS (which already operates a unified network) and adjusting to changing parcel volumes after the ecommerce surge. Although no new company was acquired this time, the way FedEx reports its numbers has changed—once again making direct year-over-year comparisons challenging.
That’s why I continuously adapt my valuation models to account for these reporting changes. If I don’t understand exactly what changed (and when), the risk of producing misleading forecasts rises dramatically. Back to the model…
(*) CofC = Circle of Competence
