
When “Hedges” Hurt: Lessons from $GLD and $SLV Cycles
Clients, friends, and anyone who knows I work with investments often ask for a view on the price of gold. The answer is consistent: not much, because gold prices sit outside my circle of competence. To have a view on any commodity, it is essential to know who the suppliers are, how much they can produce, and at what cost—in other words, to build a cost curve for the commodity in question. Without that information, any allocation to such a commodity could be too speculative, even if the true intention is to provide a hedge against inflation or as a diversification within a broader portfolio.
However, a long-term perspective on how gold prices (and their often-mentioned companion, silver) behaved—particularly during the U.S. inflation run-up in the 1970s and 1980s—can still be useful; look at the chart, which shows gold (dark blue), gold adjusted for inflation (light blue), silver (dark green), and silver adjusted for inflation (light green).
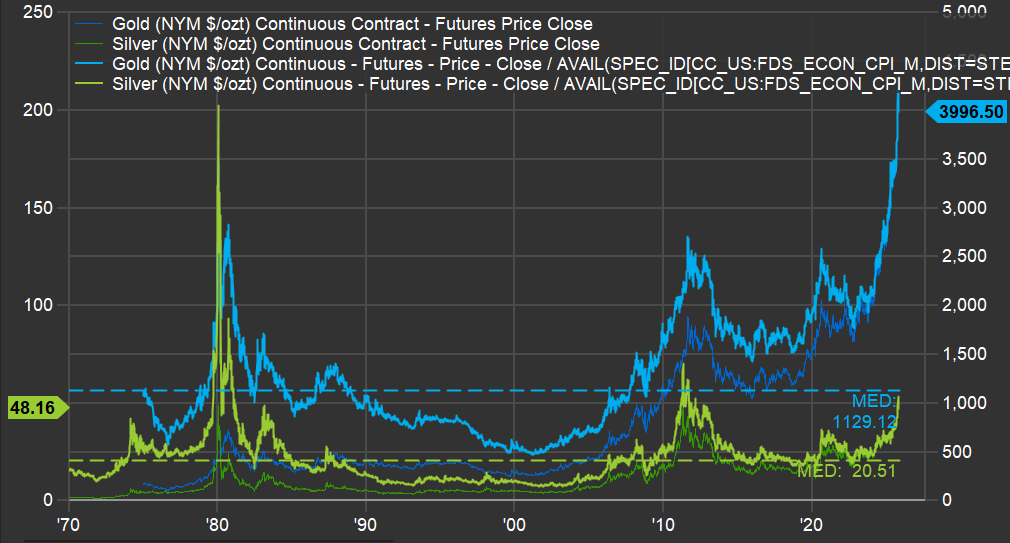
First, on gold: when inflation was rampant in the late 1970s, gold, in today’s dollars, reached roughly $2,800 per ounce; today’s level sits about 43% above that prior peak. However, that peak was 45 years ago, implying a real return close to 1% per year since then. What followed should give current gold holders pause: prices declined for roughly 20 years, reaching around $500 per ounce in the early 2000s—an 82% drawdown, leaving about 18% of the original investment two decades later.
Silver is even more extreme. It is around $50 per ounce today, after having surpassed $200 per ounce (in today’s dollars) in 1980; by the 2000s, it traded near $8 per ounce—a roughly 96% decline from that earlier level. Imagine looking at an “inflation hedge” bucket and finding only 4% of it remained.
That’s as far as this analysis goes for these two precious metals: invest with care, recognizing that prices can always rise, but extended speculative phases can produce negative returns for decades. In silver’s case, the closest it came to its 1980 record was about $60 per ounce in the early 2010s—still roughly 70% below the peak.