Understanding long-term drivers for auto parts sales
I’m working on $AAP (Advance Auto Parts) today, one of the top three auto parts retailers - more on the business later. Now I’m sharing two charts I have in my analysis to ensure I’m aware of some secular trends affecting the industry.
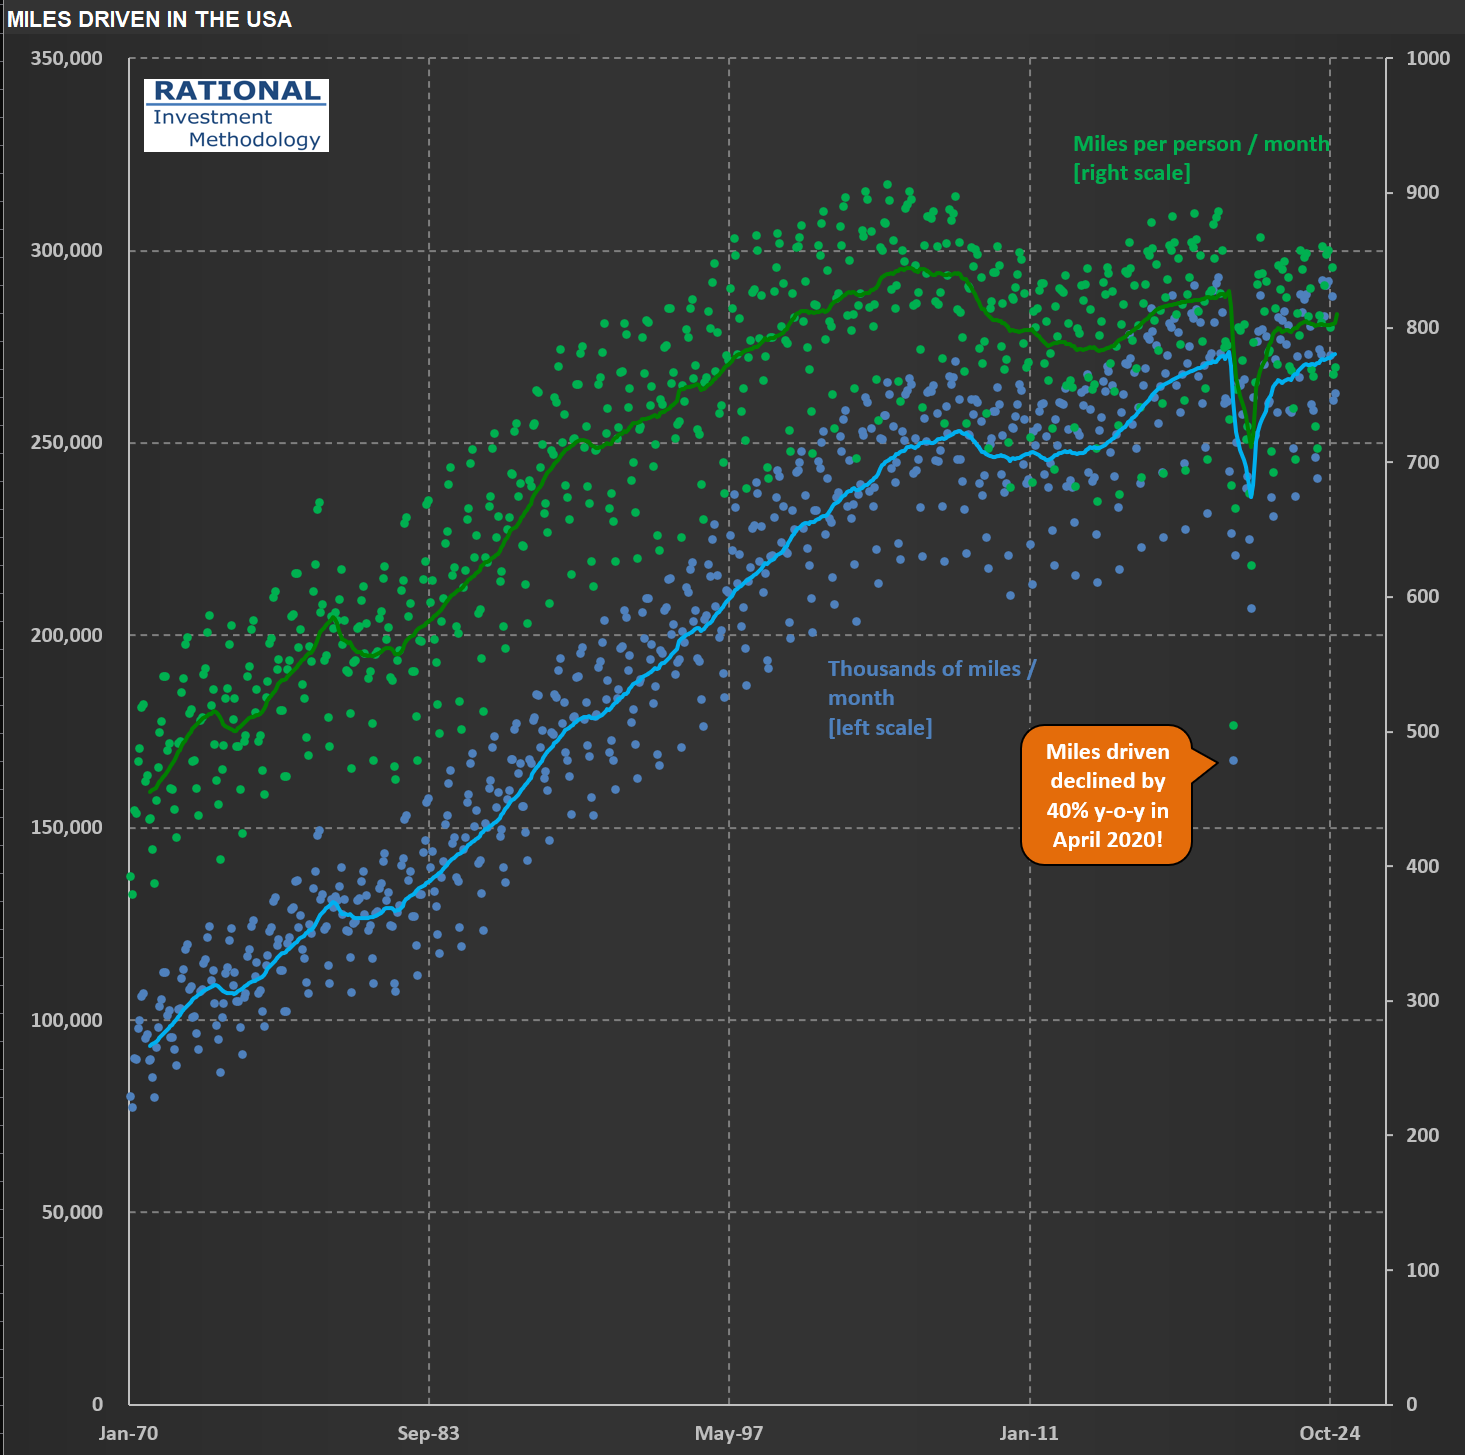
The first shows total miles driven (in blue) and miles driven per person (in green). The lines are a trailing 12-month figure. Total miles driven still grows, but not by much. It is interesting to note, however, that miles driven per person peaked in 2005—two decades ago!
If people drive less, they should be buying fewer cars—at least per capita, right? We observe this in the data—see the second chart. The blue dots show cars sold per month. In red, an index of how many cars were bought per capita is shown. The peak of car purchases in the US happened in the summer of 1979! The last peak of absolute numbers of vehicles sold in 12 months happened 25 years ago, in the summer of 2000.
These figures help me calibrate the underlying potential auto parts sales. On top of the drivers I just shared, I still need to consider how long cars last nowadays. For example, if one observes that we have an “aging fleet” in the US and concludes that they are going to need more auto parts, that might not be the case if cars just last longer. Technology has made parts more durable. Hence you have to consider a cascade of effects when trying to understand what will impact sales in the long run.

