What's Driving PACCAR's ($PCAR) Recent Sales Slowdown?
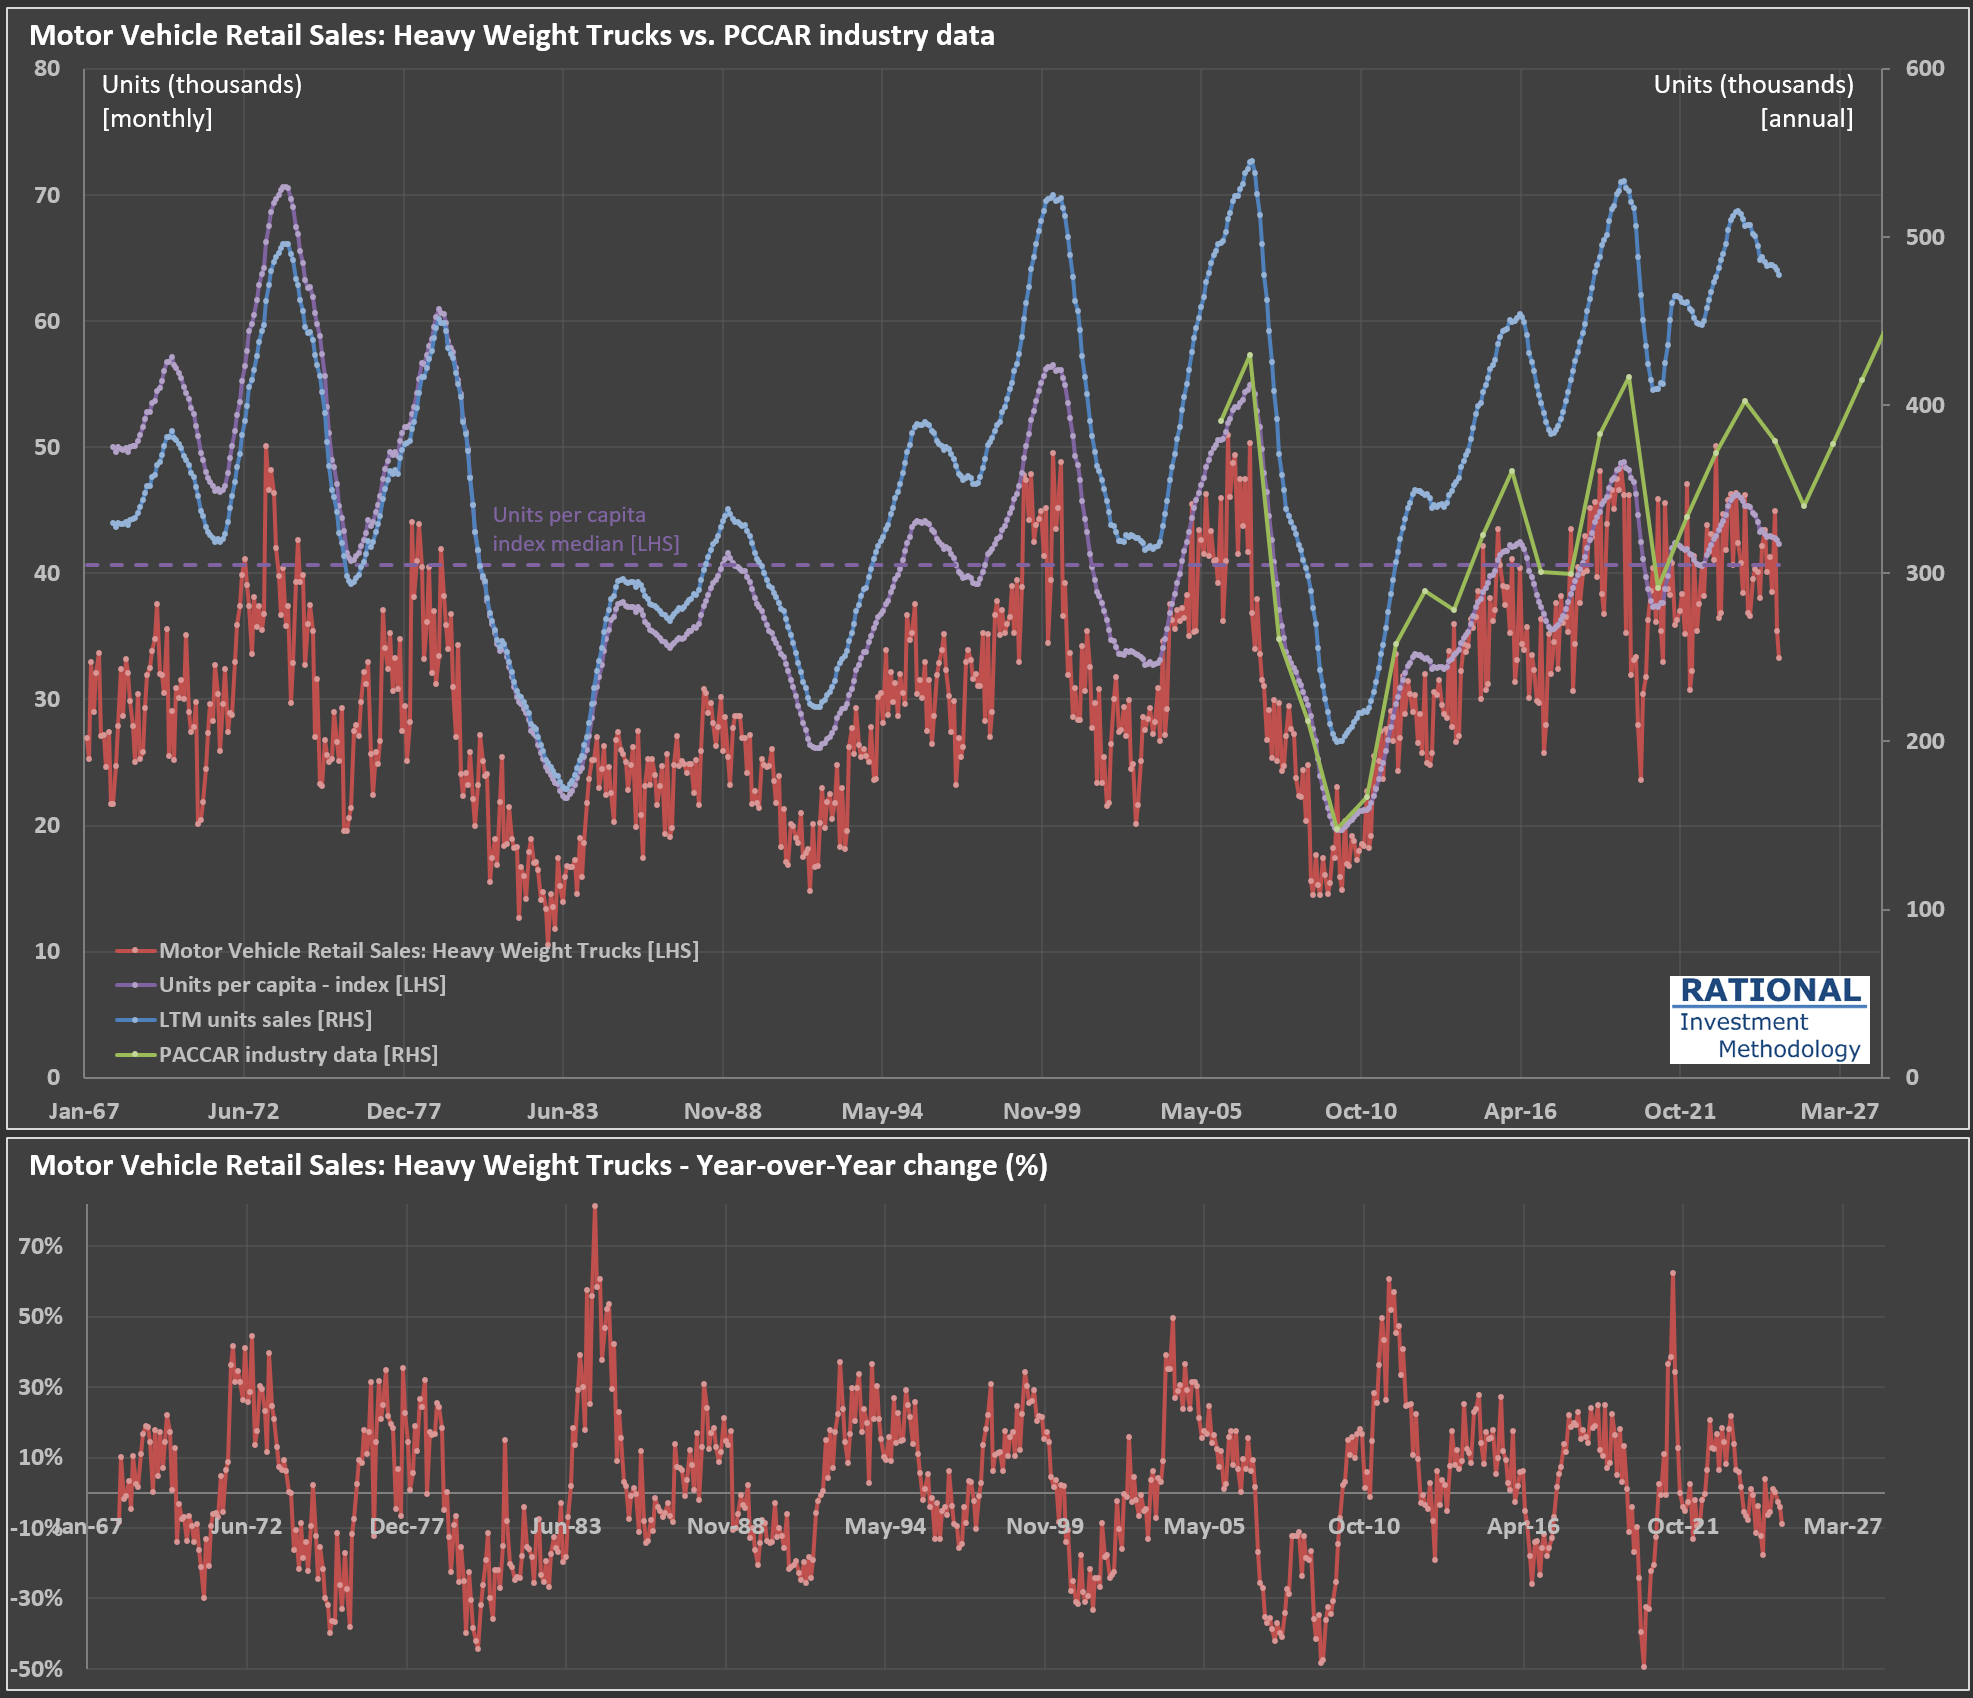
I’m analyzing $PCAR (PACCAR Inc.) today, a leading trucking manufacturer in the US and Europe. Check out the chart below—it illustrates several key data series. The red line represents monthly sales of heavy-weight trucks in the US (in thousands of units; from the U.S. Bureau of Economic Analysis via the FRED system). The blue line (scale on the right) shows cumulative truck sales over the last twelve months (LTM).
Ideally, this LTM series should closely track PACCAR’s industry sales data (green line)—they are close but not equal, as the data from the FRED system encompasses a broader category of trucks. Indeed, the correlation between these two series (blue and green) is quite high at 96%. This means we can reliably use monthly U.S. Bureau of Economic Analysis data to anticipate PACCAR’s sales trends.
Recent figures indicate a slowdown following exceptionally strong post-pandemic sales. Trucking companies earned unusually high profits during the pandemic (as discussed in my previous post here), prompting them to order trucks aggressively. With freight rates normalizing and transported volumes below trend, these companies are dialing back their purchases. Consequently, manufacturers like PACCAR are experiencing declining earnings.
Interestingly, this current cycle hasn’t been particularly severe. Notice the purple dotted line—it measures truck sales per capita in the US. Over the past decade or so, sales cycles have become relatively muted, even when factoring in pandemic-related volatility (the bottom chart shows year-over-year changes clearly). Imagine how challenging it must be for manufacturers to manage operations amid such fluctuations.
