Watching $WAB: Rail Metrics and the Ripple Effects of Tariff Policy
I’m finishing up my update on $WAB (WabTec). The company operates in two main segments: Freight-which provides locomotives, components, and digital solutions for freight railroads-and Transit, which supplies components and services for passenger transit systems. Its core products include diesel-electric locomotives, braking systems, doors, electronics, and aftermarket rail parts. $WAB serves railroads and transit agencies worldwide.
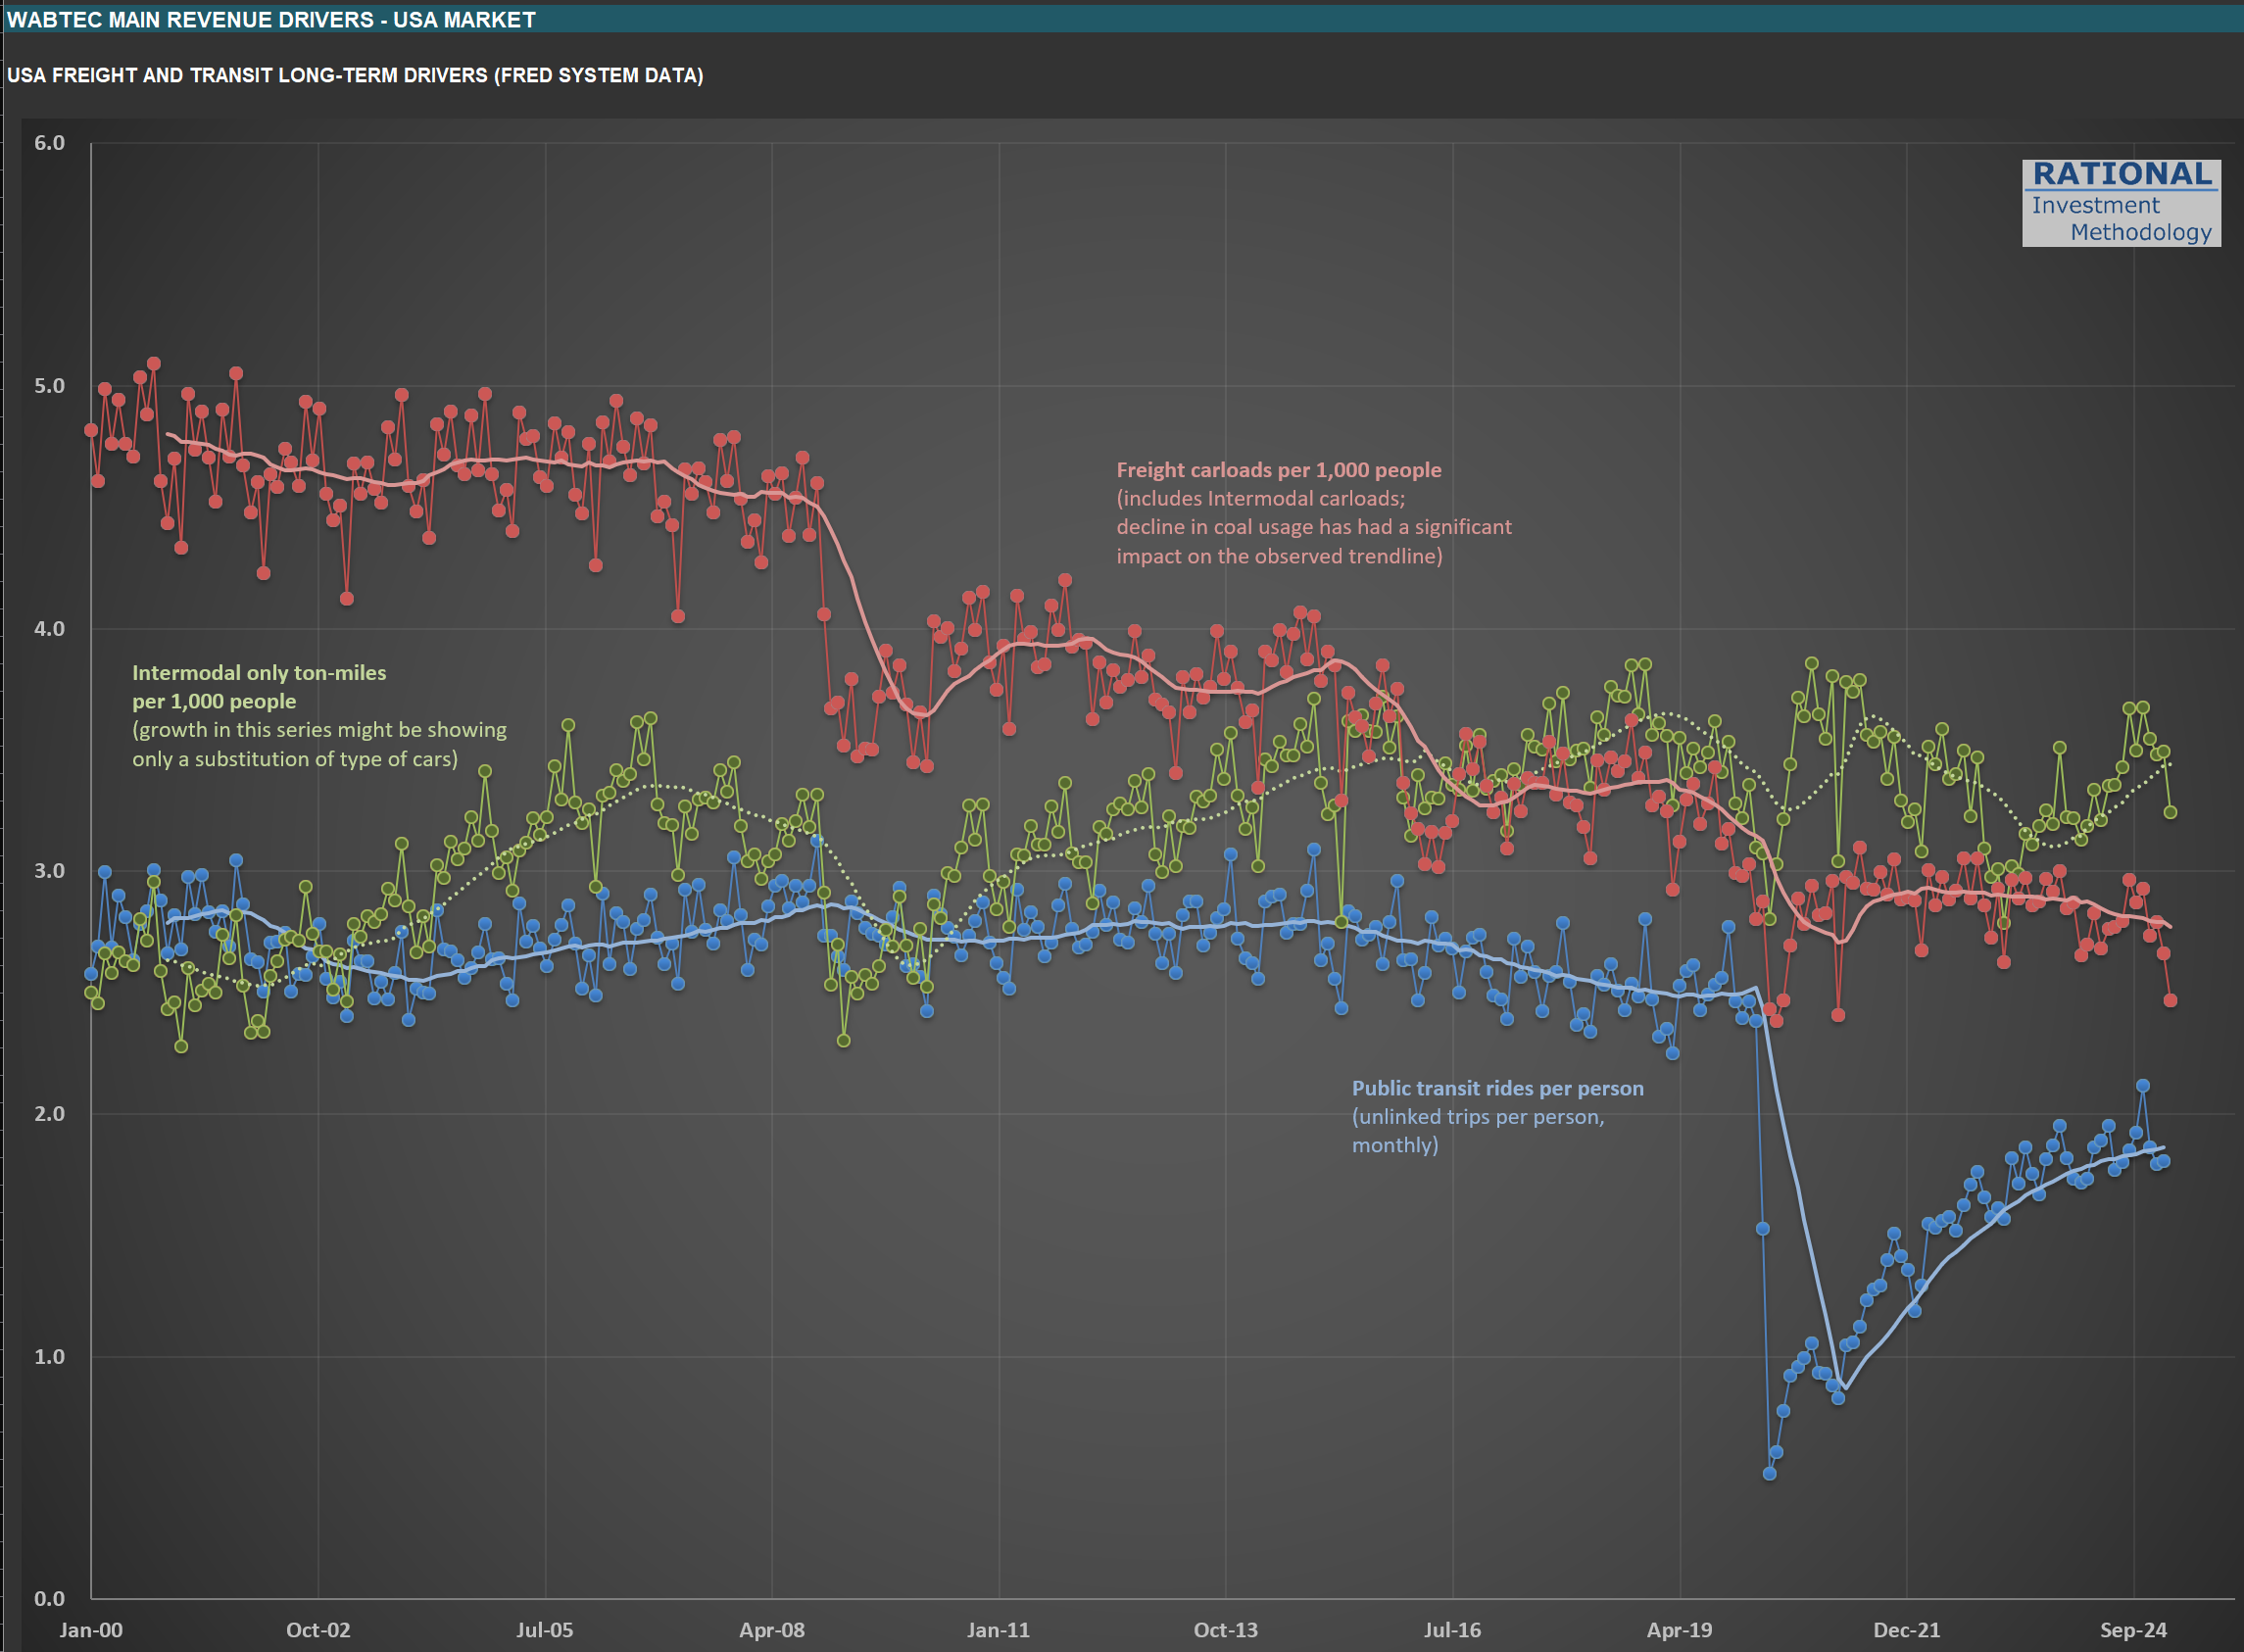
The chart below highlights three key drivers for their long-term sales:
Blue line: Public transit rides per person (unlinked trips per person, monthly). Notice that this metric still hasn’t returned to pre-pandemic levels.
Red line: Freight carloads per 1,000 people (including intermodal). The ongoing decline in coal usage has had a pronounced impact on this trend.
Green line: Intermodal-only ton-miles per 1,000 people. Much of the prior growth here reflected a shift in the type of cars used-intermodal is heavily tied to international trade.
Of these, I’ll be watching the green line most closely. It should provide a clear read on how the evolving tariff landscape is affecting rail volumes. Updating these charts is always a useful exercise, even if the monthly data arrives at a glacial pace compared to the rapid moves we see in the stock market. It’s a good reminder that the real economy moves much more slowly than prices or headlines suggest.
