Housing Bubble 2.0: How the Lock-in Effect Is Shaping an Unprecedented Market Divergence
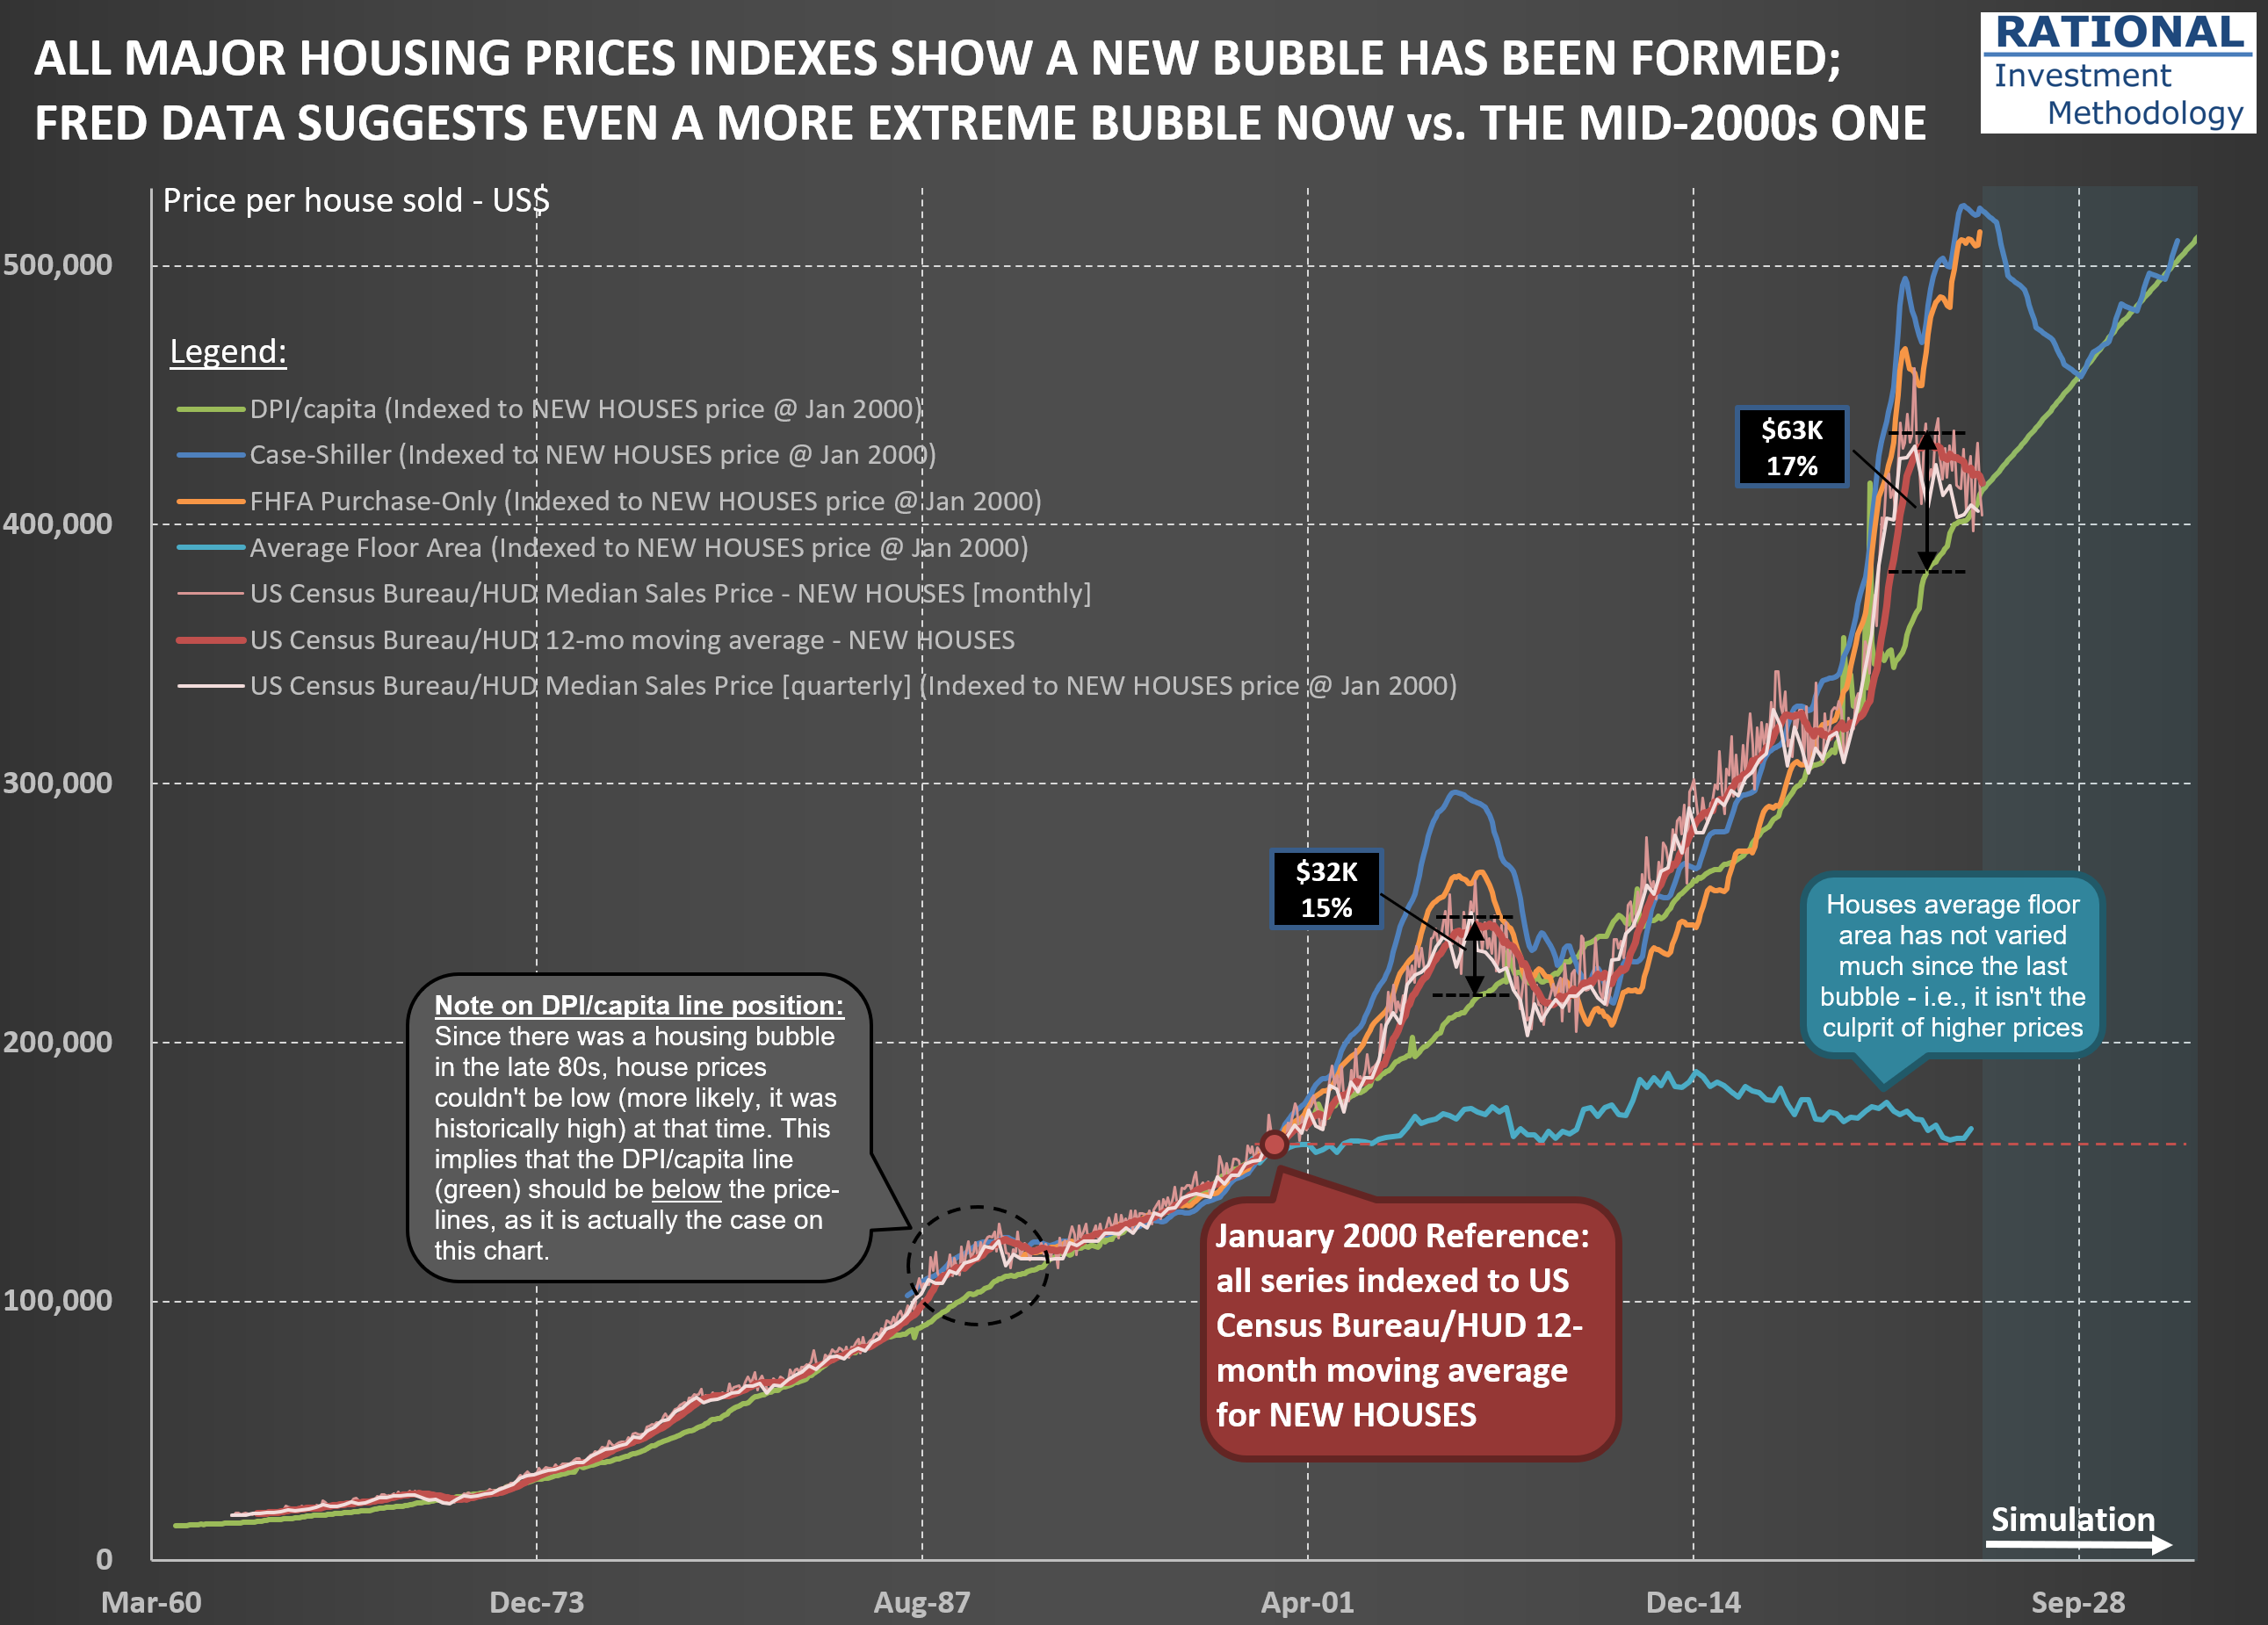
The housing market in the United States presents a fascinating case study of how interest rate policy can create significant distortions in asset prices. The chart below reveals a telling story about our current housing market.
The US Census Bureau/HUD Median Sales Price lines for houses (represented by the red lines - the darker ones for new homes; the light pink for all houses) have recently begun reverting toward the green DPI/capita reference line. This indicates that new home prices are returning to historically normal levels relative to disposable personal income. However, simultaneously, the Case-Shiller and FHFA Purchase-Only indices (blue and orange lines, respectively) remain significantly elevated compared to historical norms.
What explains this divergence? The answer lies in the dramatic difference in transaction volume and pricing dynamics between new homes and existing homes. The primary driver of this market distortion is what economists call the “lock-in effect.” As of early 2025, 82.8% of homeowners with mortgages still have an interest rate below 6%. Many of these homeowners refinanced during 2020-2021 when rates hit historic lows, securing fixed-rate mortgages often below 3%.
With current mortgage rates hovering near 7%, these homeowners face a powerful disincentive to sell. Consider the math: trading a 2.75% mortgage for a new one at 7.00% often means paying significantly more each month for a comparable or even smaller living space. Even if a homeowner could pocket some equity in such a transaction (if downsizing), the prospect of a substantially higher monthly payment creates a psychological and financial barrier few are willing to cross.
This lock-in effect has had profound implications: Existing home sales in 2024 dropped to levels last seen in 1995. New home prices are touching the DPI/capita reference line because builders must price their products at levels the market can bear-they have no choice but to adjust to current affordability metrics. Meanwhile, the relatively few existing homes that do come to market in mature neighborhoods command premium prices due to their scarcity.
Despite the powerful lock-in effect, there are forces that will eventually bring existing home prices back toward the DPI/capita line. These are what I call the “four Ds”:
- Death: Estate settlements often necessitate home sales regardless of interest rate considerations
- Divorce: Marital dissolution frequently requires liquidating shared assets
- Displacement: Job relocations or other major life changes that force moves
- Debt: Financial hardship that makes maintaining mortgage payments untenable
We’re already seeing early evidence that these forces are gradually eroding the lock-in effect. As of early 2025, the percentage of homeowners with mortgage rates at or above 6% has increased to 17.2%, up nearly five percentage points from 12.3% in the third quarter of 2023. The price adjustment process is taking its time to play out. I will later post another chart showing the difference in price deflation now vs. the bubble in the mid-2000s.
