
CHIPS Act, Data Centers, and the Shape of Policy-Driven Construction Booms
In July of last year, I did a post on construction spending in the USA due to an abnormal spike in manufacturing (here). I thought it would be interesting to complement that analysis now that I’ve added another layer of data.
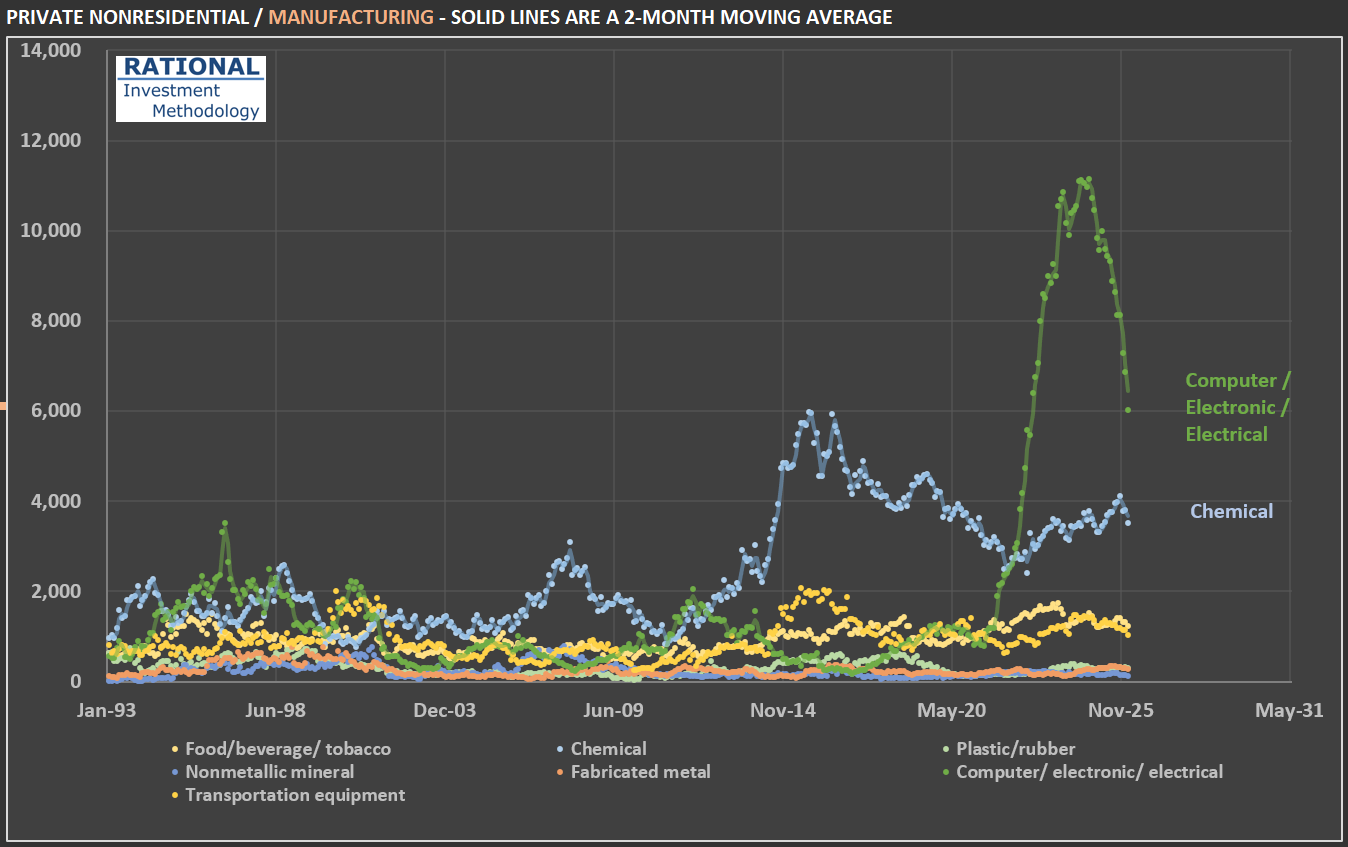
The figure that caught my attention at the time was the spike in construction related to manufacturing. The first chart shows a further split of this category. Note that the recent spike was mostly in the Computer / electronic / electrical sub-segment. Why is it so concentrated in this segment? And why was there such rapid growth followed by a steep decline?
The shape you see — a near-vertical spike followed by a rapid pullback — is the signature of a massive, concentrated, policy-driven investment wave: billions in subsidies triggered hundreds of billions in commitments, construction broke ground on dozens of mega-projects nearly simultaneously, and then spending naturally rolled off as the largest projects progressed beyond the heavy-construction phase, compounded by political uncertainty around future subsidies. In other words, this is the shape of the CHIPS Act incentives, ironically directed at an industry that is making billions in abnormal profits due to the AI boom.
Also notice the (older) spike in chemical (plants) investments. After the shale gas revolution — in the mid-2010s — made US ethane reliably cheaper than oil-based feedstocks used in Asia and Europe, chemical makers embarked on the largest building boom in the industry’s history. Cheap natural gas serves both as fuel (for heat-intensive processes like cracking) and as feedstock (ethane → ethylene → polyethylene and other derivatives). The industry rule of thumb is that when the ratio of international oil prices to local natural gas prices exceeds about 10, ethane-based chemical producers enjoy a significant cost advantage — and that ratio surged above 40 by 2012 and stayed above 20 for much of the decade.
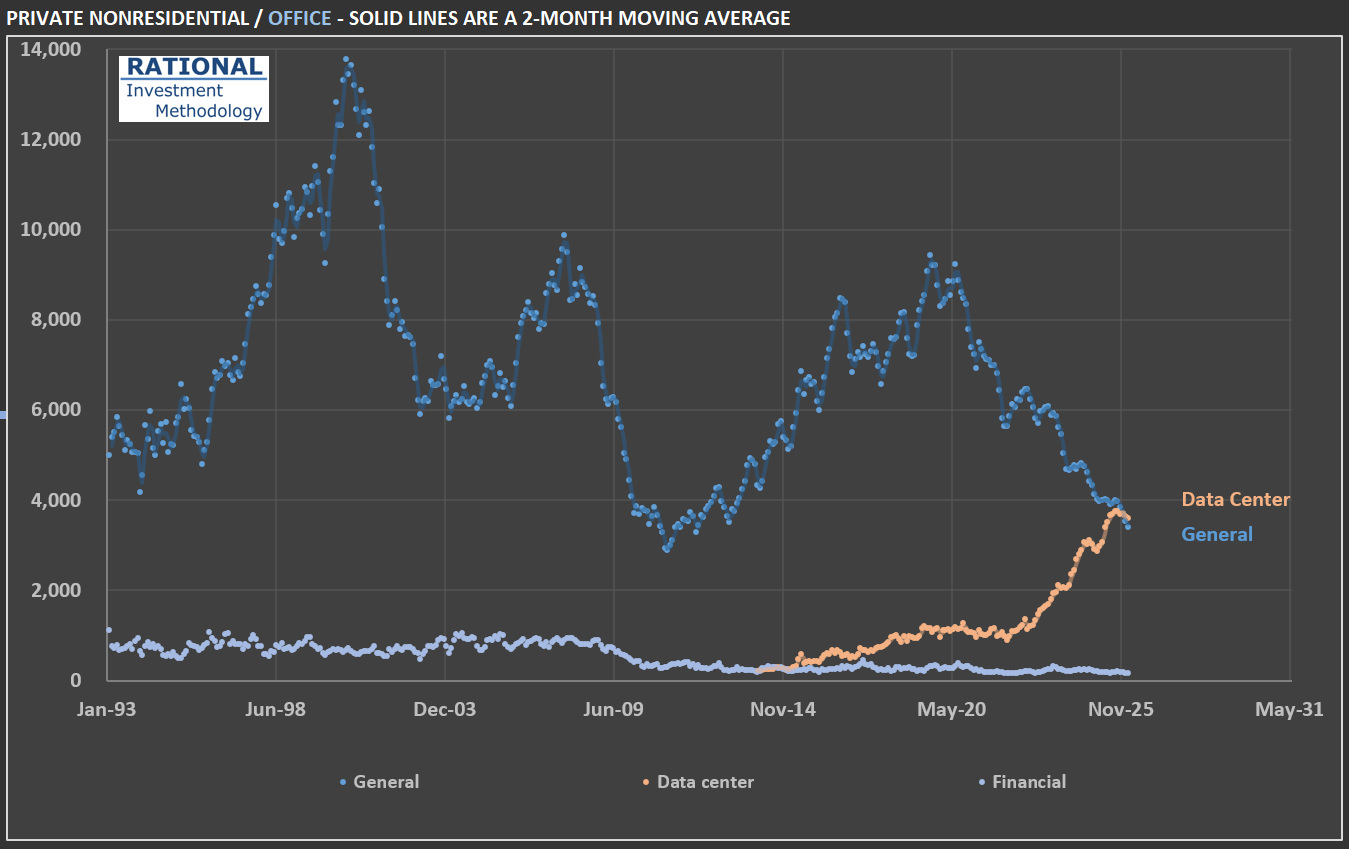
However, the most interesting data from the additional breakdown is in the office segment. Office spending, given the impact from the “work from home” phenomenon, appeared suspiciously stable. Therefore, I also split this segment. Notice in the second chart that core office investments (labeled “General” in the chart) have in fact collapsed. However, “data centers,” which have historically been categorized alongside office construction, have increased dramatically due to the AI boom. Time will tell if there was an overinvestment in this asset class. History is full of examples of overinvestment in new technologies — not because they were useless; it is quite the contrary. It is precisely because they are economy-changing events (think railroads and the internet) that overinvestment followed.
Last, note that construction-related investment in data centers pales in comparison to overall construction spending. The USA invests close to $185 billion a month in construction. Data centers, even at this new historical peak, represent slightly above 2% of the total. In other words, the money spent on data centers is in the computers inside them, not the buildings themselves. But that doesn’t prevent CEOs of companies that sell aggregates, for instance, from mentioning data centers multiple times in their earnings calls!
PS: all figures are adjusted for (i) inflation and (ii) population. The inflation adjustment is by far the biggest. But adjusting for population also gives a better idea of construction activity “as if the country had the same population”. In series that span for such a long time (more than 30 years in this case), it also makes a difference.