
$PII [Polaris]: Rig Counts, a Weak Yen, and Two Headwinds Management Can't Control
Polaris Inc. ($PII) designs, manufactures, and markets powersports vehicles: off-road vehicles (ORVs), snowmobiles, moto-roadsters, boats, and related parts, garments, and accessories (PG&A). It operates in three segments—Off Road (80% of sales), On Road (13%), and Marine (7%)—and sells through approximately 2,400 dealers in North America and over 1,500 internationally.
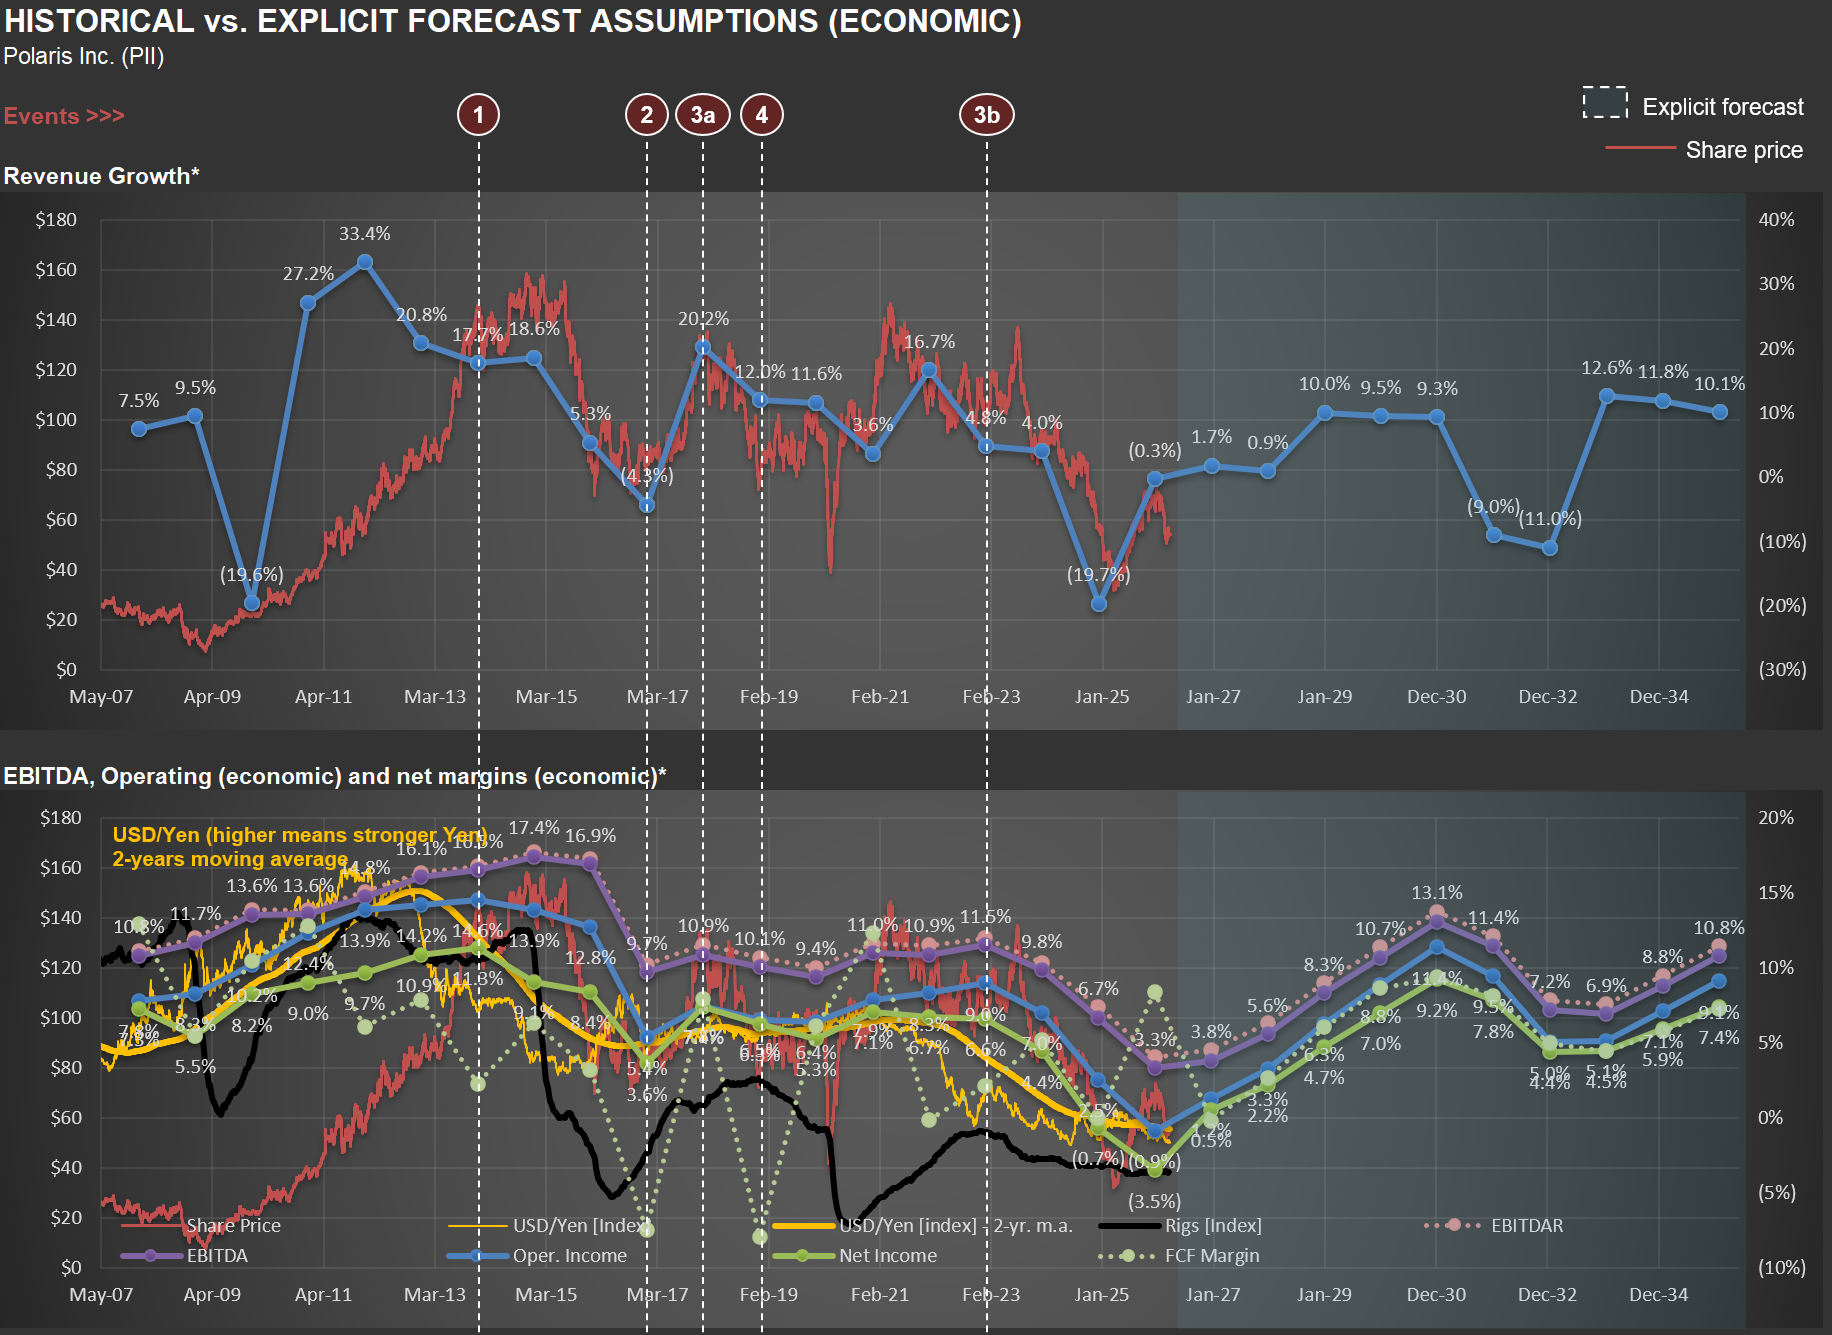
The chart below is from my valuation analysis. The top panel tracks revenue growth and share price; the bottom panel shows EBITDA and operating margin trends alongside two external variables I find revealing: the US rig count and the USD/Yen exchange rate.
The Rig Count Connection
Take a look at the bottom chart. The black line represents the US rig count, which began a steep decline around 2015. Why should this matter for a powersports company?
First, there’s a direct commercial channel. ORVs like the RANGER are genuine work vehicles on oil and gas sites, used for transporting personnel and equipment across remote locations. Polaris has a dedicated commercial business—the ProXD with approximately 250 dealers and more than 25 commercial ORV models.
But the second-order effect is arguably more significant. The oil and gas workforce is concentrated in exactly the regions where powersports culture thrives—West Texas, the Permian Basin, Oklahoma, North Dakota’s Bakken region, Louisiana, Wyoming, parts of Appalachia. These are communities where hunting, trail riding, ranch work, and outdoor recreation are central to the lifestyle. When rig counts collapse, the economic multiplier is severe: workers lose high-paying jobs, local businesses suffer, and discretionary spending on $15,000 recreational vehicles evaporates.
The rig count isn’t just a proxy for commercial demand—it’s a proxy for the purchasing power of a core Polaris demographic. The timing in the chart aligns with the period when Polaris’s revenue growth decelerated and margins came under pressure.
The Yen as a Competitive Weapon
Now focus on the yellow line—an index for the USD/Yen exchange rate. Polaris’s primary ORV competitors include Honda, Yamaha, and Kawasaki—all Japanese manufacturers. The company’s 10-K explicitly acknowledges that foreign competitors who manufacture in their home countries can sell at lower prices.
When the Yen weakens against the dollar, those manufacturers' cost base becomes cheaper in dollar terms, giving them room to cut prices and gain share. The Yen moved from roughly 80 per dollar in 2012 to 120+ by 2015, and has been close to 160 more recently (i.e., one USD now buys twice as many Yen as it did in 2012). That’s a massive structural cost advantage for Japanese OEMs. Polaris, manufacturing primarily in the US and Mexico with a dollar-denominated cost base, doesn’t get that benefit.
Notice in the chart how periods of Yen weakness tend to coincide with margin pressure at Polaris. The company’s response has been to lean into innovation and premium products—bigger screens, new models, more trim levels—rather than competing on price. But that only works until the price gap gets too wide for consumers.
The Pincer Effect
The combination of both factors—depressed energy-region economies reducing demand from a core customer base AND Japanese competitors gaining a structural cost advantage—creates a pincer effect that helps explain the margin compression visible in the chart from roughly 2015 onward. Neither is within management’s control, yet both materially affect the business. Without recognizing these dynamics, one might mistakenly attribute the compression entirely to execution issues or cyclical softness. With them, the picture becomes clearer—and the analytical challenge becomes knowing when, if ever, these headwinds will reverse.