
CofC: Consumer Discretionary - Automobiles & Components
$PII [Polaris]: Rig Counts, a Weak Yen, and Two Headwinds Management Can't Control
Polaris Inc. ($PII) designs, manufactures, and markets powersports vehicles: off-road vehicles (ORVs), snowmobiles, moto-roadsters, boats, and related parts, garments, and accessories (PG&A). It operates in three segments—Off Road (80% of sales), On Road (13%), and Marine (7%)—and sells through approximately 2,400 dealers in North America and over 1,500 internationally.
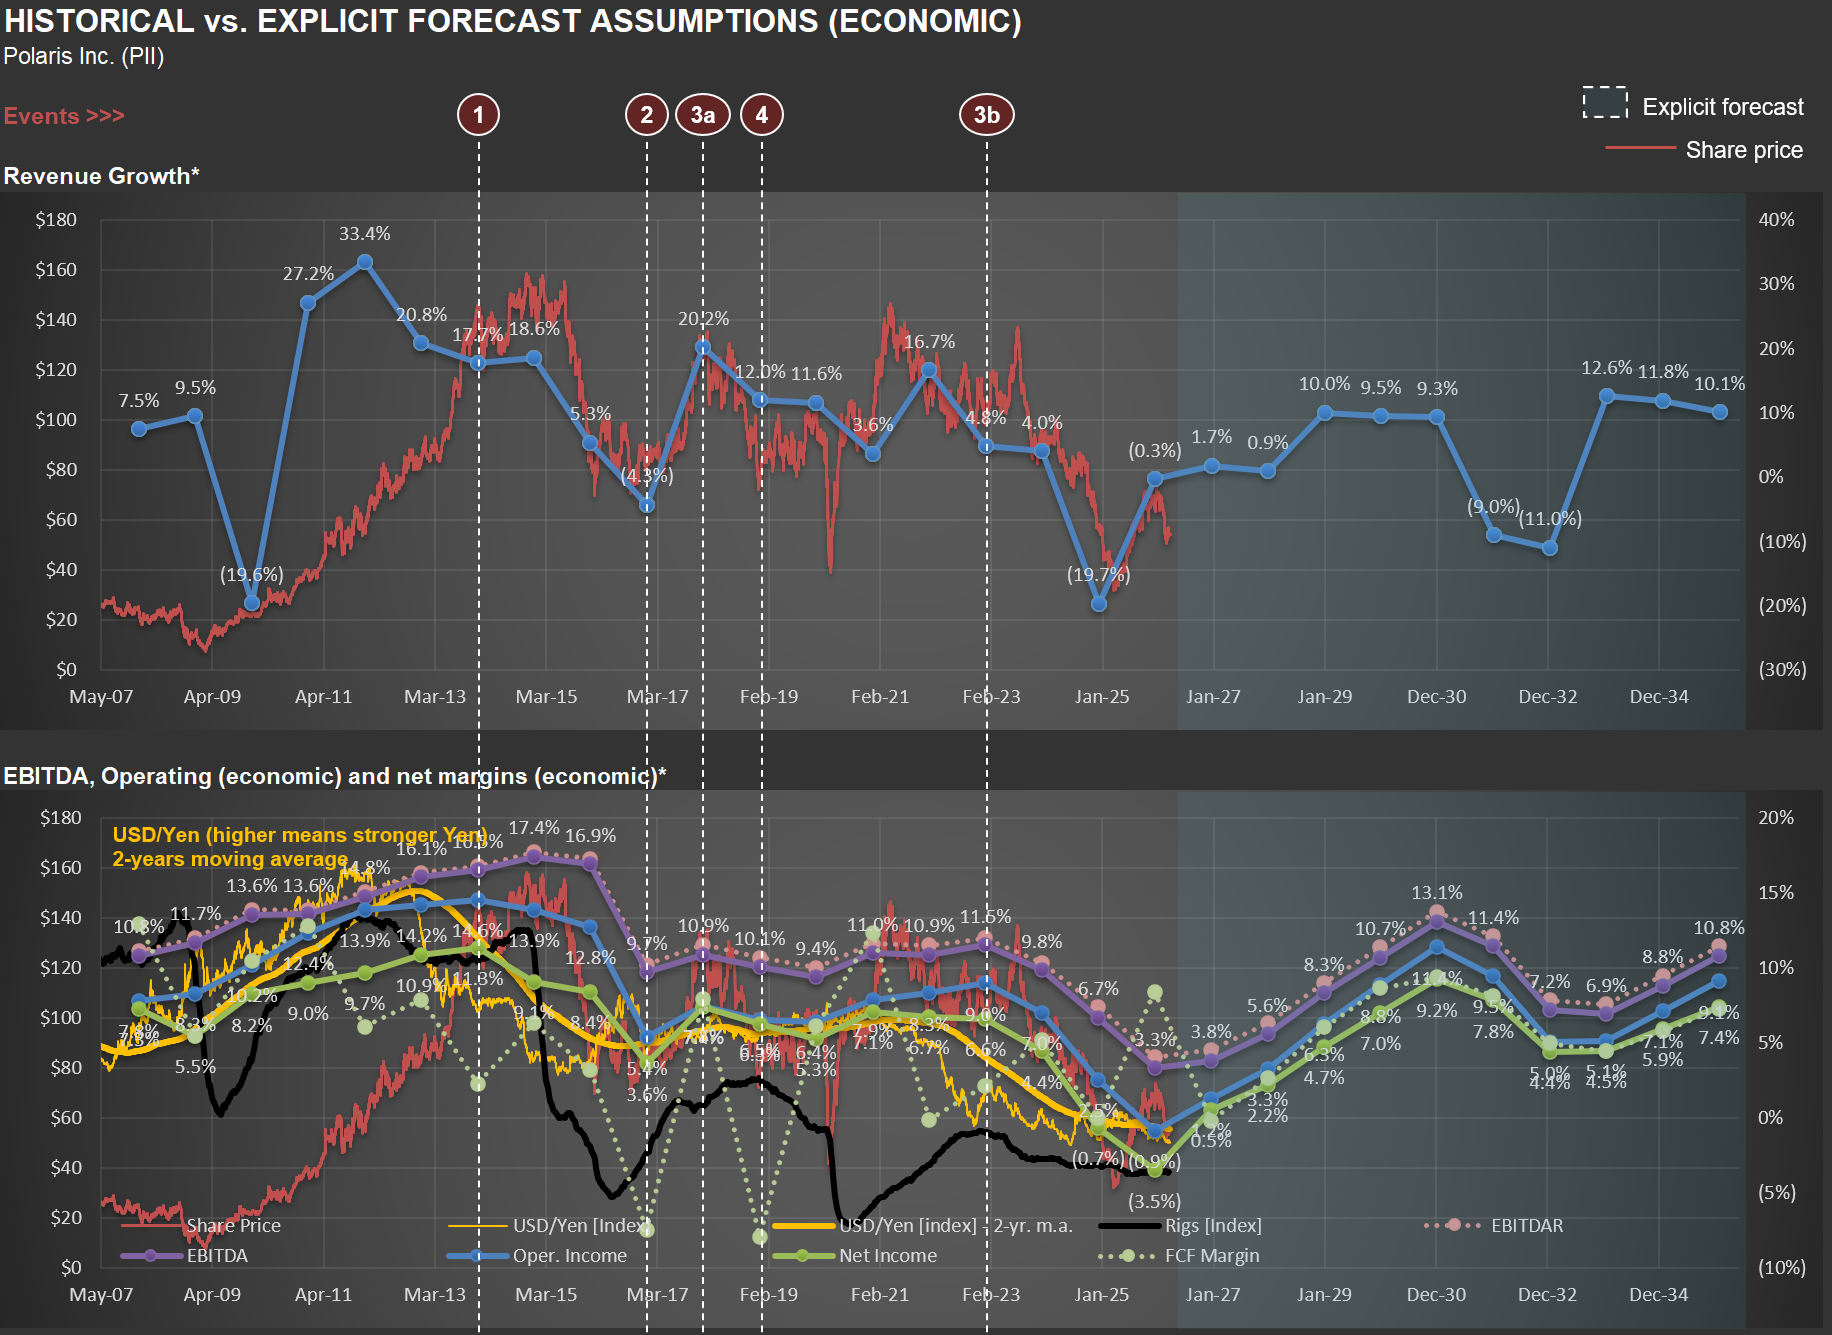
The chart below is from my valuation analysis. The top panel tracks revenue growth and share price; the bottom panel shows EBITDA and operating margin trends alongside two external variables I find revealing: the US rig count and the USD/Yen exchange rate.
The Rig Count Connection
Take a look at the bottom chart. The black line represents the US rig count, which began a steep decline around 2015. Why should this matter for a powersports company?
First, there’s a direct commercial channel. ORVs like the RANGER are genuine work vehicles on oil and gas sites, used for transporting personnel and equipment across remote locations. Polaris has a dedicated commercial business—the ProXD with approximately 250 dealers and more than 25 commercial ORV models.
But the second-order effect is arguably more significant. The oil and gas workforce is concentrated in exactly the regions where powersports culture thrives—West Texas, the Permian Basin, Oklahoma, North Dakota’s Bakken region, Louisiana, Wyoming, parts of Appalachia. These are communities where hunting, trail riding, ranch work, and outdoor recreation are central to the lifestyle. When rig counts collapse, the economic multiplier is severe: workers lose high-paying jobs, local businesses suffer, and discretionary spending on $15,000 recreational vehicles evaporates.
The rig count isn’t just a proxy for commercial demand—it’s a proxy for the purchasing power of a core Polaris demographic. The timing in the chart aligns with the period when Polaris’s revenue growth decelerated and margins came under pressure.
The Yen as a Competitive Weapon
Now focus on the yellow line—an index for the USD/Yen exchange rate. Polaris’s primary ORV competitors include Honda, Yamaha, and Kawasaki—all Japanese manufacturers. The company’s 10-K explicitly acknowledges that foreign competitors who manufacture in their home countries can sell at lower prices.
When the Yen weakens against the dollar, those manufacturers' cost base becomes cheaper in dollar terms, giving them room to cut prices and gain share. The Yen moved from roughly 80 per dollar in 2012 to 120+ by 2015, and has been close to 160 more recently (i.e., one USD now buys twice as many Yen as it did in 2012). That’s a massive structural cost advantage for Japanese OEMs. Polaris, manufacturing primarily in the US and Mexico with a dollar-denominated cost base, doesn’t get that benefit.
Notice in the chart how periods of Yen weakness tend to coincide with margin pressure at Polaris. The company’s response has been to lean into innovation and premium products—bigger screens, new models, more trim levels—rather than competing on price. But that only works until the price gap gets too wide for consumers.
The Pincer Effect
The combination of both factors—depressed energy-region economies reducing demand from a core customer base AND Japanese competitors gaining a structural cost advantage—creates a pincer effect that helps explain the margin compression visible in the chart from roughly 2015 onward. Neither is within management’s control, yet both materially affect the business. Without recognizing these dynamics, one might mistakenly attribute the compression entirely to execution issues or cyclical softness. With them, the picture becomes clearer—and the analytical challenge becomes knowing when, if ever, these headwinds will reverse.
Consumer Confidence and RV Sales: Insights from Thor Industries ($THO)
I just finished updating my analysis of $THO (Thor Industries), the largest manufacturer of RVs (Recreational Vehicles) in the US. The U.S. RV market is dominated by a few major players, often called the “Big 3”: Thor, Forest River (a Berkshire Hathaway company), and Winnebago, an iconic name in the RV world.
Thor’s management shared in their latest earnings release that retail demand has generally aligned with expectations, despite some challenges in the first half of FY25 (August 2024 to January 2025). While there was improvement in the second half, it was less than initially anticipated, prompting a revision of prior guidance. The slight increase in consumer confidence in May 2025 is a positive sign for retail demand through the end of FY25 (July 2025). However, aggressive tariff policies could weigh on demand in the latter half of the calendar year if their impact on Average Sales Prices (ASPs) is not effectively managed industry-wide. They also expect the first quarter of fiscal 2026 (June to August 2025) to be challenging.
The main reason for this cautious outlook? Tariff uncertainties. Now, consider that Thor has already been navigating significant fluctuations in demand—see the picture below. The blue line illustrates quarterly deliveries in their “towables” segment, the company’s largest. Imagine running a production line that must handle between 20,000 and 70,000 units every three months, without knowing in advance when demand will be strong or weak.
Thor sells highly discretionary products—you don’t really need an RV! Because of this, their sales levels serve as a strong indicator of real consumer confidence. I’ll be watching their numbers closely as we move through what remains an unnecessarily volatile economic and operational environment.

What Harley-Davidson's Financing Data Reveals About the US Consumer
$HOG (Harley-Davidson) operates as two distinct businesses: a motorcycle manufacturer and a consumer financing provider. In fact, Harley-Davidson Financial Services financed over 70% of the motorcycles sold in 2024. Like any company offering financing, it must set aside provisions for potential credit losses.
The chart below illustrates these credit loss provisions (in basis points) relative to their total outstanding receivables portfolio. Notice the significant spike in 2009 during the Great Financial Crisis (GFC)—a severity that’s tough to surpass. (You might also spot my 2018 comment, noting future cycles would come, though likely not as extreme as the GFC.)
But more importantly, observe how elevated these provisions have been over the past two years (and likely continuing into 2025). Those surprised by recessionary signals today simply haven’t been paying attention to the right indicators. As I’ve mentioned in previous posts, the US consumer has already exhibited recessionary behavior for some time.

Recreational Boating Market Hits Recession-Era Levels
The recreational boating market reveals some concerning trends (which might lead to buying opportunities in the sector). The chart below shows powerboat sales estimates from my $BC (Brunswick) analysis, with the square-marked lines telling an important story. Sales volumes for 2024/2025, measured in units or inflation-adjusted dollars, have retreated to levels we haven’t seen since 2010-2012 – the early recovery period following the Great Recession (circled in green). Even more striking is how these figures compare to the pre-housing bubble era that ended in late 2005 (circled in yellow).
While headline GDP numbers might suggest economic health (I’ll share updated GDP charts and some comments in a future post), the recreational boating industry is experiencing significant challenges. This disconnect between broad economic indicators and sector-specific realities is worth noting for investors.
Brunswick’s recent actions highlight these difficulties. During their Q4 2024 conference call, the CEO candidly shared: “If you look from 1 January 2024 to 31 December, we unfortunately had to exit about 20% of our hourly staff and 7% of our salaried staff. The majority of that happened in the back half of the year when it was clear that we had to reduce our production levels to support year-end inventory levels that we needed to go into 2025.”
What does this mean for the broader discretionary spending landscape? I believe the American consumer is currently in a recession, as comments like the one above - and figures shown in the picture below - don’t show up during a healthy economy. But as always, this too shall pass, and Brunswick and other companies in the sector will revert to normalized sales levels.

America's Declining Motorcycle Market and What It Means for Harley Davidson
Bloomberg is conducting a comprehensive series of special segments on $HOG [Harley Davidson], highlighting significant shifts in the American motorcycle market - hence this post. The evolution of motorcycle sales per capita in the United States has shown a staggering decline over recent years, as illustrated in the chart below.
Surprisingly, Americans now purchase fewer large motorcycles (over 600cc) than Europeans, despite having advantages that traditionally supported motorcycle ownership: abundant open spaces for riding, widespread garage availability for storage, and higher income per capita. This represents a fundamental shift in the American motorcycle culture that Harley Davidson has long dominated.
As part of my ongoing analysis of recreational vehicle markets, I’m currently researching $BC [Brunswick Corporation], a leader in the marine industry. I’ll be sharing insights on the boating sector soon, examining whether similar consumption pattern changes are occurring across different recreational vehicle categories.
