
$MLKN One Year Later: A 70% Surge in Computer Spending—and Why China's Most Valuable Company Makes Memory
A year ago I published a short note on $MLKN (MillerKnoll, the largest office furniture manufacturer in the Western hemisphere) built around a chart that had surprised me (here). The argument was that spending on information processing hardware—a series that had moved more or less in step with office furniture demand for decades—had broken away from it. I noted that the latest year-over-year increase had passed 41%, the highest reading on record for that data series, and I closed by saying it would be interesting to watch how sustainable that pace really was.
I have now updated the same two charts. Sustainable is not the word that comes to mind.
What the series actually measures
Before the numbers, it is worth being precise about what is being counted, because the name of the parent category is broad enough that most people hear it as “IT budgets.”
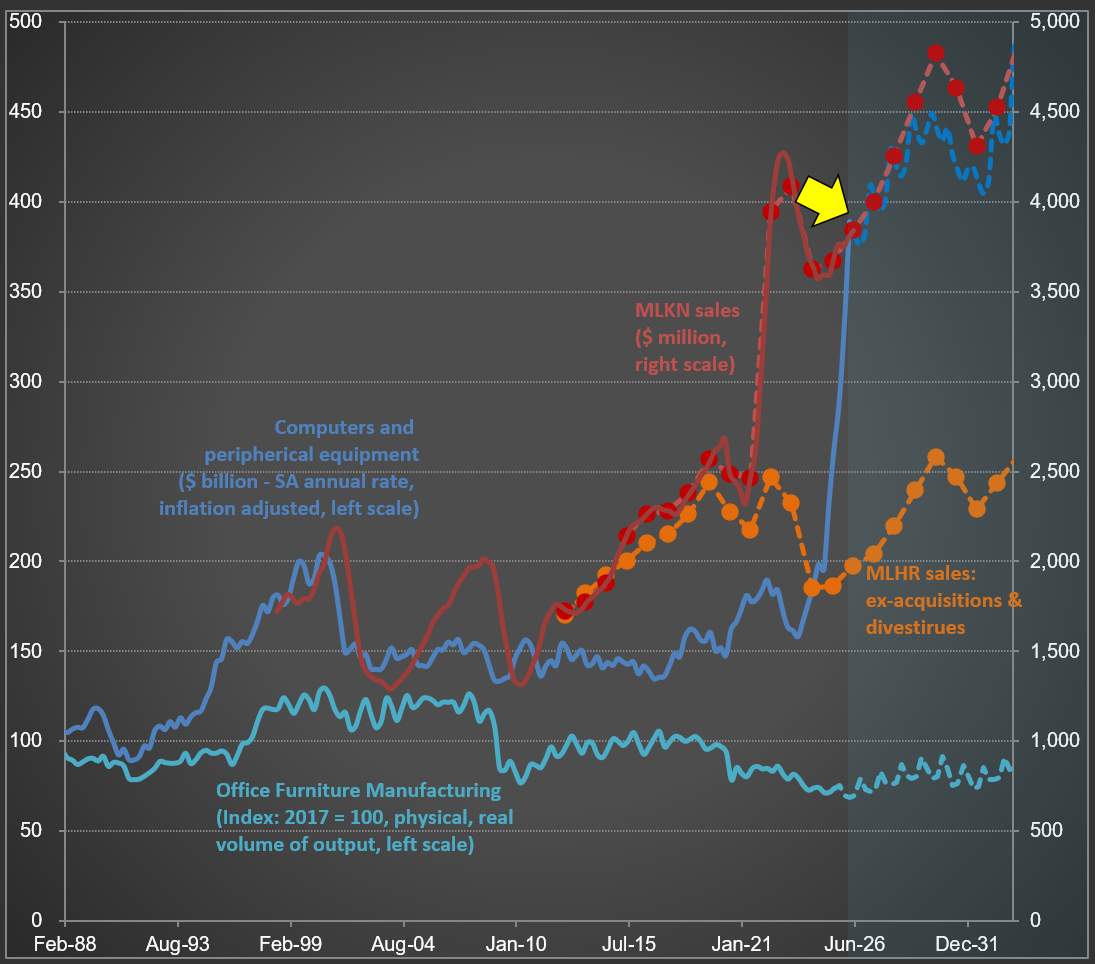
The data comes from the Bureau of Economic Analysis’s National Income and Product Accounts, under Private Fixed Investment, Nonresidential (FRED series B935RC1Q027SBEA). The heading it sits under—Information Processing Equipment and Software—is wide, but the line I plot is a single component of it: Computers and Peripheral Equipment. That means physical hardware, and only physical hardware: servers, mainframes, workstations and personal computers, storage devices, printers, terminals, monitors, and the peripherals attached to them. So when this line moves, it is not a story about subscriptions or licenses or engineering headcount. It is a story about boxes going into buildings—which, today, means data centers.
The level
At the last actual reading, the series is running at roughly $390 billion, seasonally adjusted at an annual rate and inflation adjusted. A year ago, when I wrote the earlier post, it was about $250 billion. In late 2024 it was near $195 billion. For most of the 2010s it sat around $150 billion—and, as I pointed out then, it had barely moved in real terms from the post-Internet-1.0 bust of 2002 all the way to early 2020.
One point deserves emphasis, because it cuts against the objection I would expect. This is the BEA’s current-dollar series, not its chained, quality-adjusted one. The Bureau publishes a real measure of the same line that deflates computer hardware with hedonic price indexes, so that a server delivering more compute per dollar registers as more “investment” even if the check is the same size. I am not using that. What you are looking at is money out the door. The surge is not an artifact of chips getting faster.
The rate of change
The second chart is the one that stops me. The year-over-year increase in the latest quarter is close to 70%.
There is nothing in the four decades shown on the chart that comes anywhere near it. The mid-1990s—the genuine internet build-out, the one that ended in the 2000-2002 bust and that I marked with the pink box—peaked at roughly 25%. The record I flagged a year ago, 41%, has now been beaten by more than half again. Whatever else this is, it is not a normal capital spending cycle.
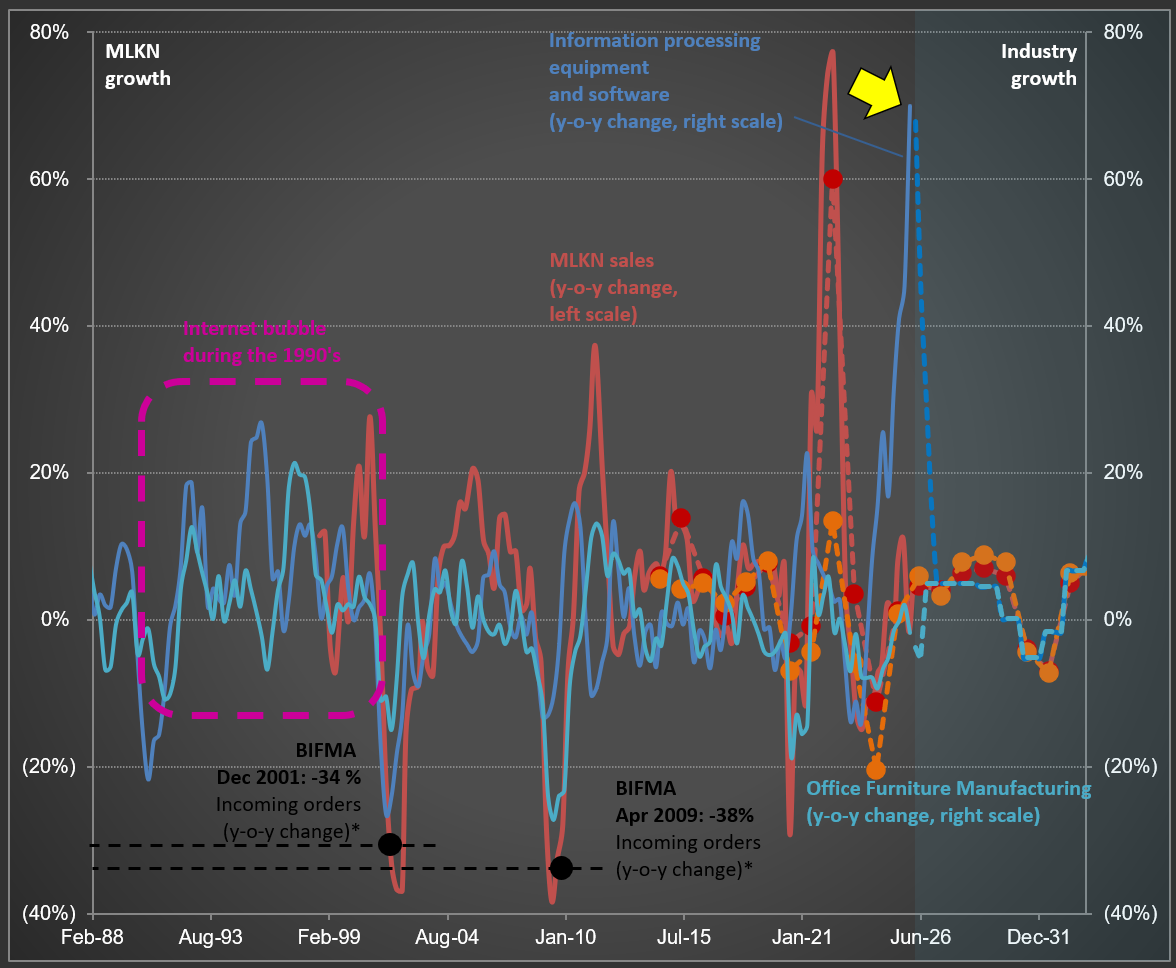
And the contrast inside the same chart is the whole point. Office Furniture Manufacturing—a physical volume index, 2017 = 100—is sitting near 70. That is roughly a third below where it stood nine years ago, with MillerKnoll’s sales around $3.7 billion. Two series that used to swing together, and that lined up neatly with BIFMA’s incoming-order collapses in December 2001 (-34%) and April 2009 (-38%), are now describing two different economies.
And now, China
Which brings me to today’s Wall Street Journal (here). ChangXin Memory Technologies (CXMT), the Hefei-based DRAM manufacturer, listed on Shanghai’s STAR Market and closed its first session up roughly 466%, at a market capitalization near 3.3 trillion yuan—about $490 billion. That makes it the most valuable listed company in mainland China, ahead of ICBC. Its first-quarter revenue was RMB 50.8 billion, up more than 700% year over year, and it swung to an operating profit of RMB 35.4 billion from a loss a year earlier. It holds something under 8% of the global DRAM market.
It is no coincidence that the most valuable listed company in China is a memory manufacturer. Two reasons, and they are worth separating.
The first is what memory is. DRAM is about as close to a pure commodity as anything manufactured today. A part is specified almost entirely by two numbers—how much it holds and how fast bits move in and out—plus power draw and form factor. That is the datasheet. A buyer qualifies one supplier’s chip against another’s and substitutes it. There is no brand, no switching cost, no ecosystem, no franchise. It is fungible, spot-priced, and historically subject to brutal cycles. Which makes an earnings increase of that magnitude, in that industry, a statement about scarcity—not about competitive advantage.
The second is where the money came from. CXMT’s revenue did not appear out of nowhere. It is the mirror image of the line in my first chart. The servers being installed in data centers are the demand; the DRAM inside them is the supply. A 70% surge in computer and peripheral equipment investment and a 700% surge in a memory maker’s revenue are not two facts. They are one fact, observed from the buyer’s accounts and from the seller’s.
What that combination usually means
Explosive profitability in a commodity industry is evidence of a shortage, not of a moat. And shortages call forth capacity: CXMT has said it will direct the bulk of its IPO proceeds toward production lines and wafer capacity, and so is every one of its competitors. Capacity is precisely what ends shortages. That sequence—commodity product, record margins, record capital spending, a company barely ten years old becoming the most valuable listed name in its market—has an unusually consistent historical rhyme.
I made the underlying point in my Polaroid post a couple of months ago (here): the technology being real was never the question. The price always was. What an owner should be asking, at these levels, is what Internal Rate of Return he is signing up for over the entire life of these businesses—including the part of the cycle when the capacity now being built actually arrives.
Back to the furniture
So here we are. The Market is pricing one of these two series as if its boom were permanent, and the other as if its slump were. MillerKnoll and its industry sit a third below their 2017 output while the hardware line goes vertical. I do not know which quarter the reversion begins. I do know that the last time this series ran away from everything around it, it gave back a quarter of its level in eight quarters—and that a product fully described by two numbers does not stay this profitable for very long.