CofC: Industrials - Commercial & Professional Services
$MLKN and the “AI Arms Race”: Why Tech Spend and Furniture Sales No Longer Move Together
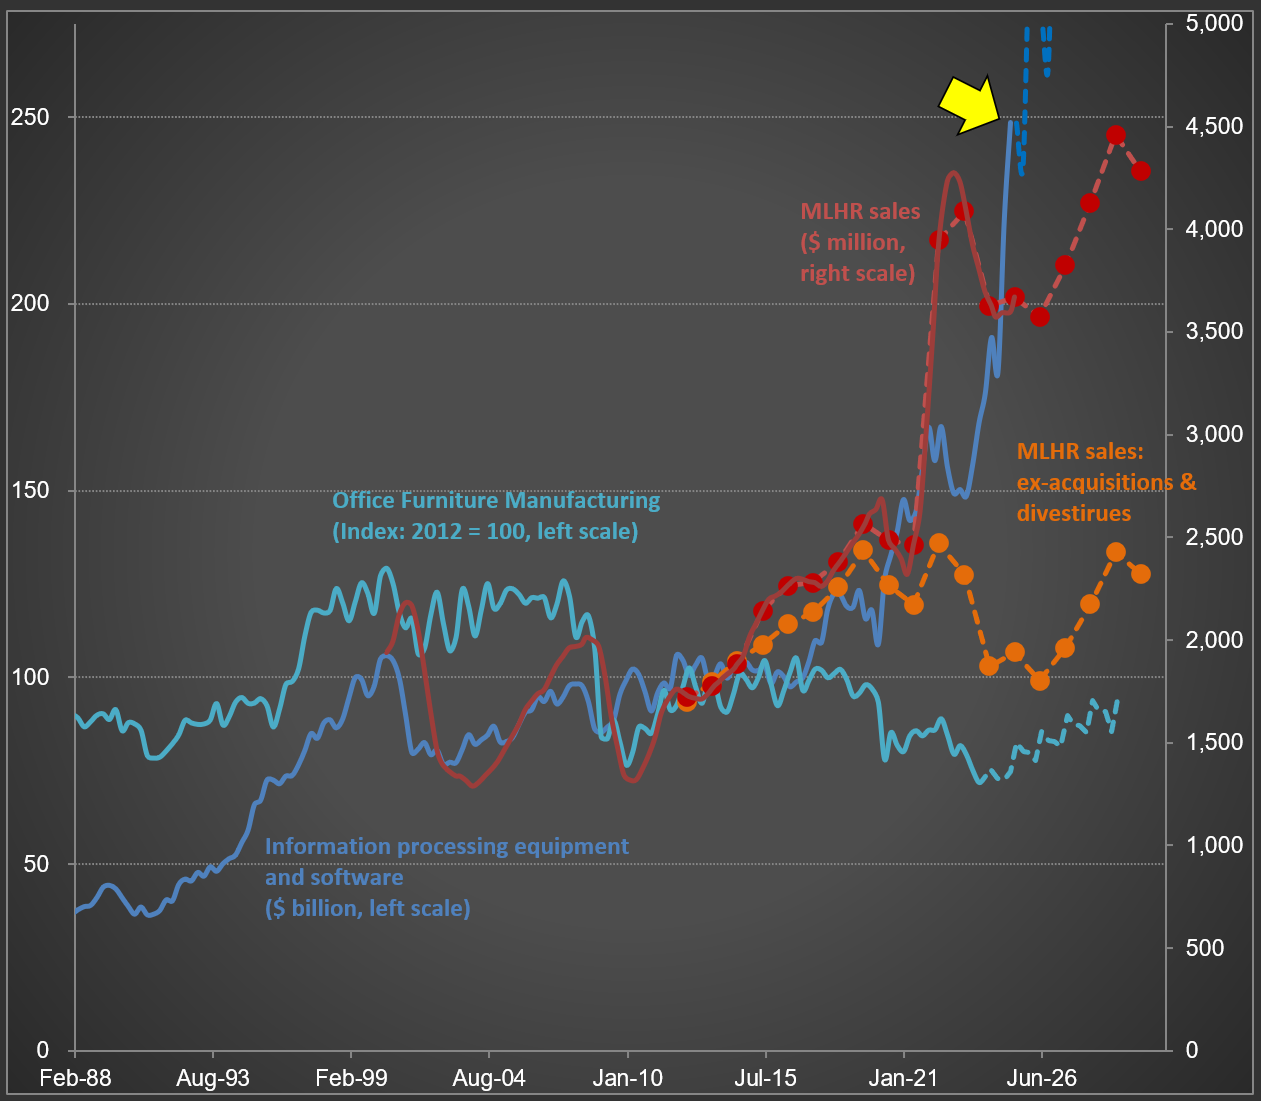
While updating my analysis for $MLKN (MillerKnoll; the largest office furniture company in the Western hemisphere), I was struck by the sharp rise in Information Processing Equipment and Software spending (dark blue line)—take a look at the first chart below. The most recent datapoint, highlighted by the yellow arrow, shows annualized sales reaching $250 billion.
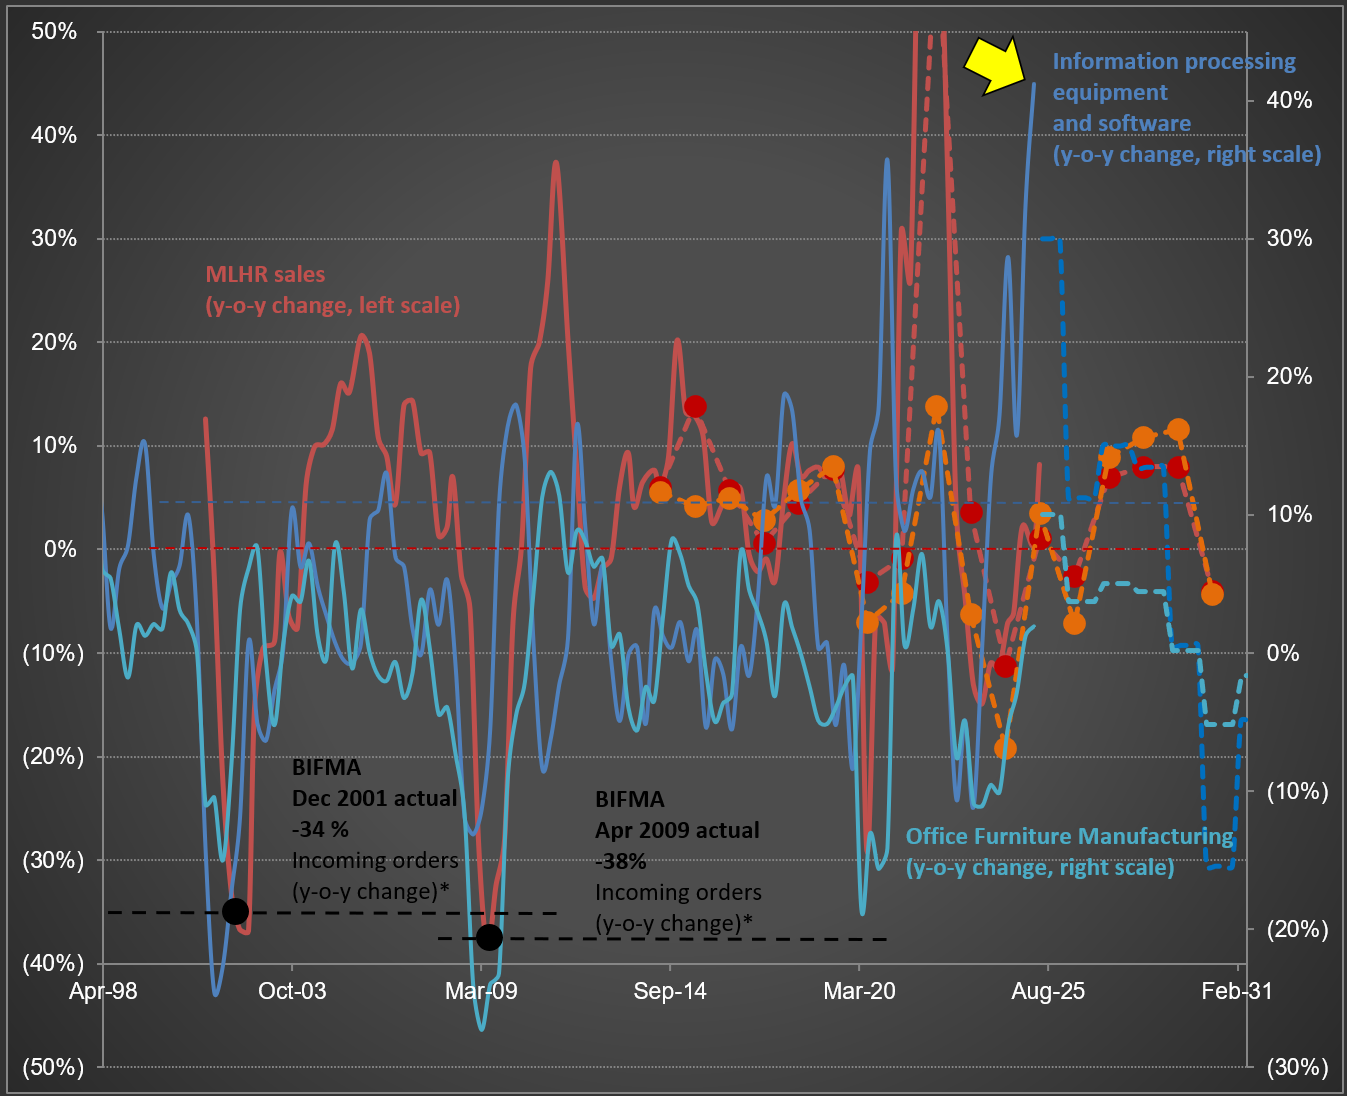
The second chart, which tracks year-over-year changes, illustrates why I’ve included not only MillerKnoll’s sales but also two broader industry data series (including Office Furniture Manufacturing). Notice how the volatility in the blue lines closely mirrors the swings in MillerKnoll sales (in red), and even lines up with significant industry downturns reported by BIFMA (the Business and Institutional Furniture Manufacturers Association) in both 2001 and 2009.
Perhaps someday, Information Processing Equipment and Software spending will once again move in step with office furniture sales. For now, though, it seems primarily driven by today’s “AI arms race.” The latest year-over-year increase surpassed 41%—the highest on record for this data series. It’s also striking that if you adjust for inflation, this series remained at a similar level from the post-Internet 1.0 bust in 2002 up until early 2020. The dramatic surge started only after that point. It will be interesting to see in the coming years how sustainable (or not) this pace really is.


How Government Incentives Are Shaping $WM’s Capital Decisions
Today, I’m deep into my analysis of $WM (Waste Management). On any given day, the company’s teams collect waste and recyclables from 21 million homes and businesses, operate fleets along set routes, and move materials to processing or disposal facilities.
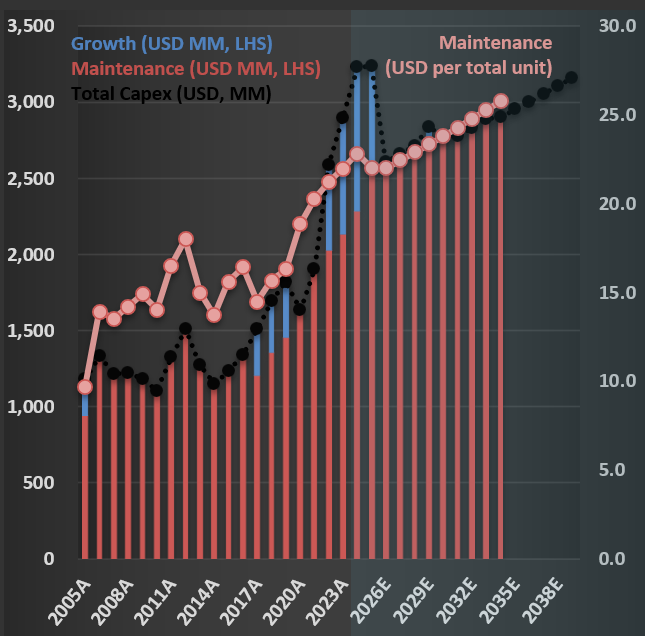
As I incorporate insights from the latest Investor Day, I’m reminded how influential—and sometimes questionable—regulations can be from an economic perspective. Back in 2016, nearly a decade ago, I added a note on the CapEx (capital expenditure) section of the WM’s model: “Since 2005, organic growth has been mostly negative—therefore, I will assume no Growth CapEx; this means that recent CapEx is an excellent estimate of necessary Maintenance CapEx.”
That forecast primarily held. For years, most of Waste Management’s CapEx focused on maintaining existing operations. If you look at the first chart below, you’ll see that CapEx was, until 2022, dominated by red (Maintenance CapEx), with only a modest amount in blue (Growth CapEx). But in 2022, there’s a clear uptick in growth investment. What changed?
The answer lies in the Inflation Reduction Act (IRA), which introduced a range of incentives for renewable energy. RNIs (Renewable Identification Numbers) and LCFS (Low Carbon Fuel Standard) credits now make producing RNG (Renewable Natural Gas) from landfills “economically” attractive.
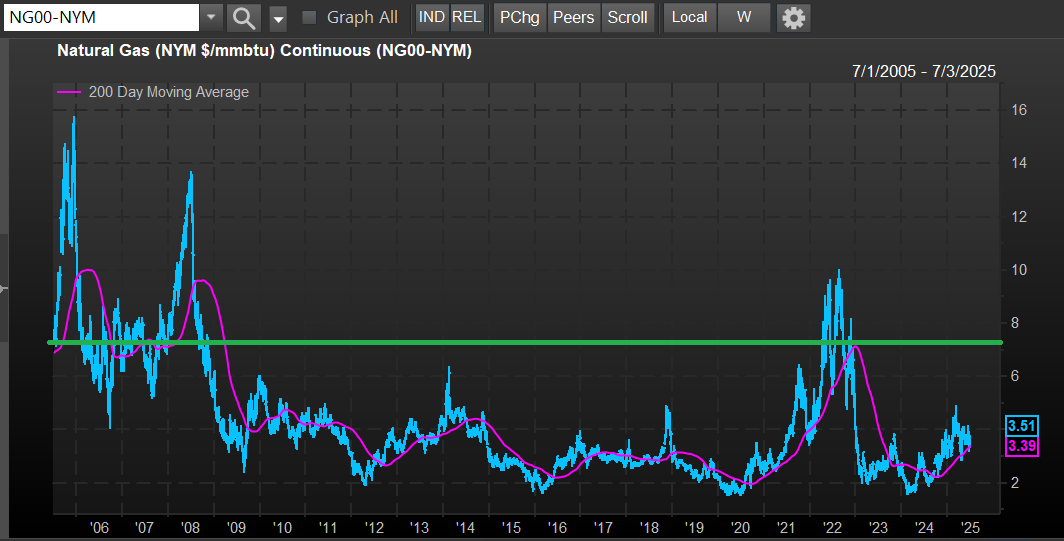
Why the quotation marks around “economically”? If you dig into the actual costs of producing RNG from landfills, estimates range from $ 7.50 to $ 21.50 per MMBtu. For context, take a look at the second figure below, which shows the price of natural gas in the U.S. over the last 20 years. The green line marks the lowest cost to produce RNG—notice how it compares to market prices. In other words, without incentives, RNG production is not profitable.
The key risk for Waste Management is that if government incentives are withdrawn, these new assets could quickly become uneconomical, even if we treat the initial CapEx as a sunk cost. Time will tell whether this was a prudent long-term investment.

