$PCAR Update: Where Are We in the Heavy Truck Market Cycle?
I’ve just finished updating my analysis on $PCAR (Paccar), a leading heavy truck manufacturer in the US. Much like my earlier post on Volvo trucks (here), $PCAR’s performance tends to mirror broader economic cycles.
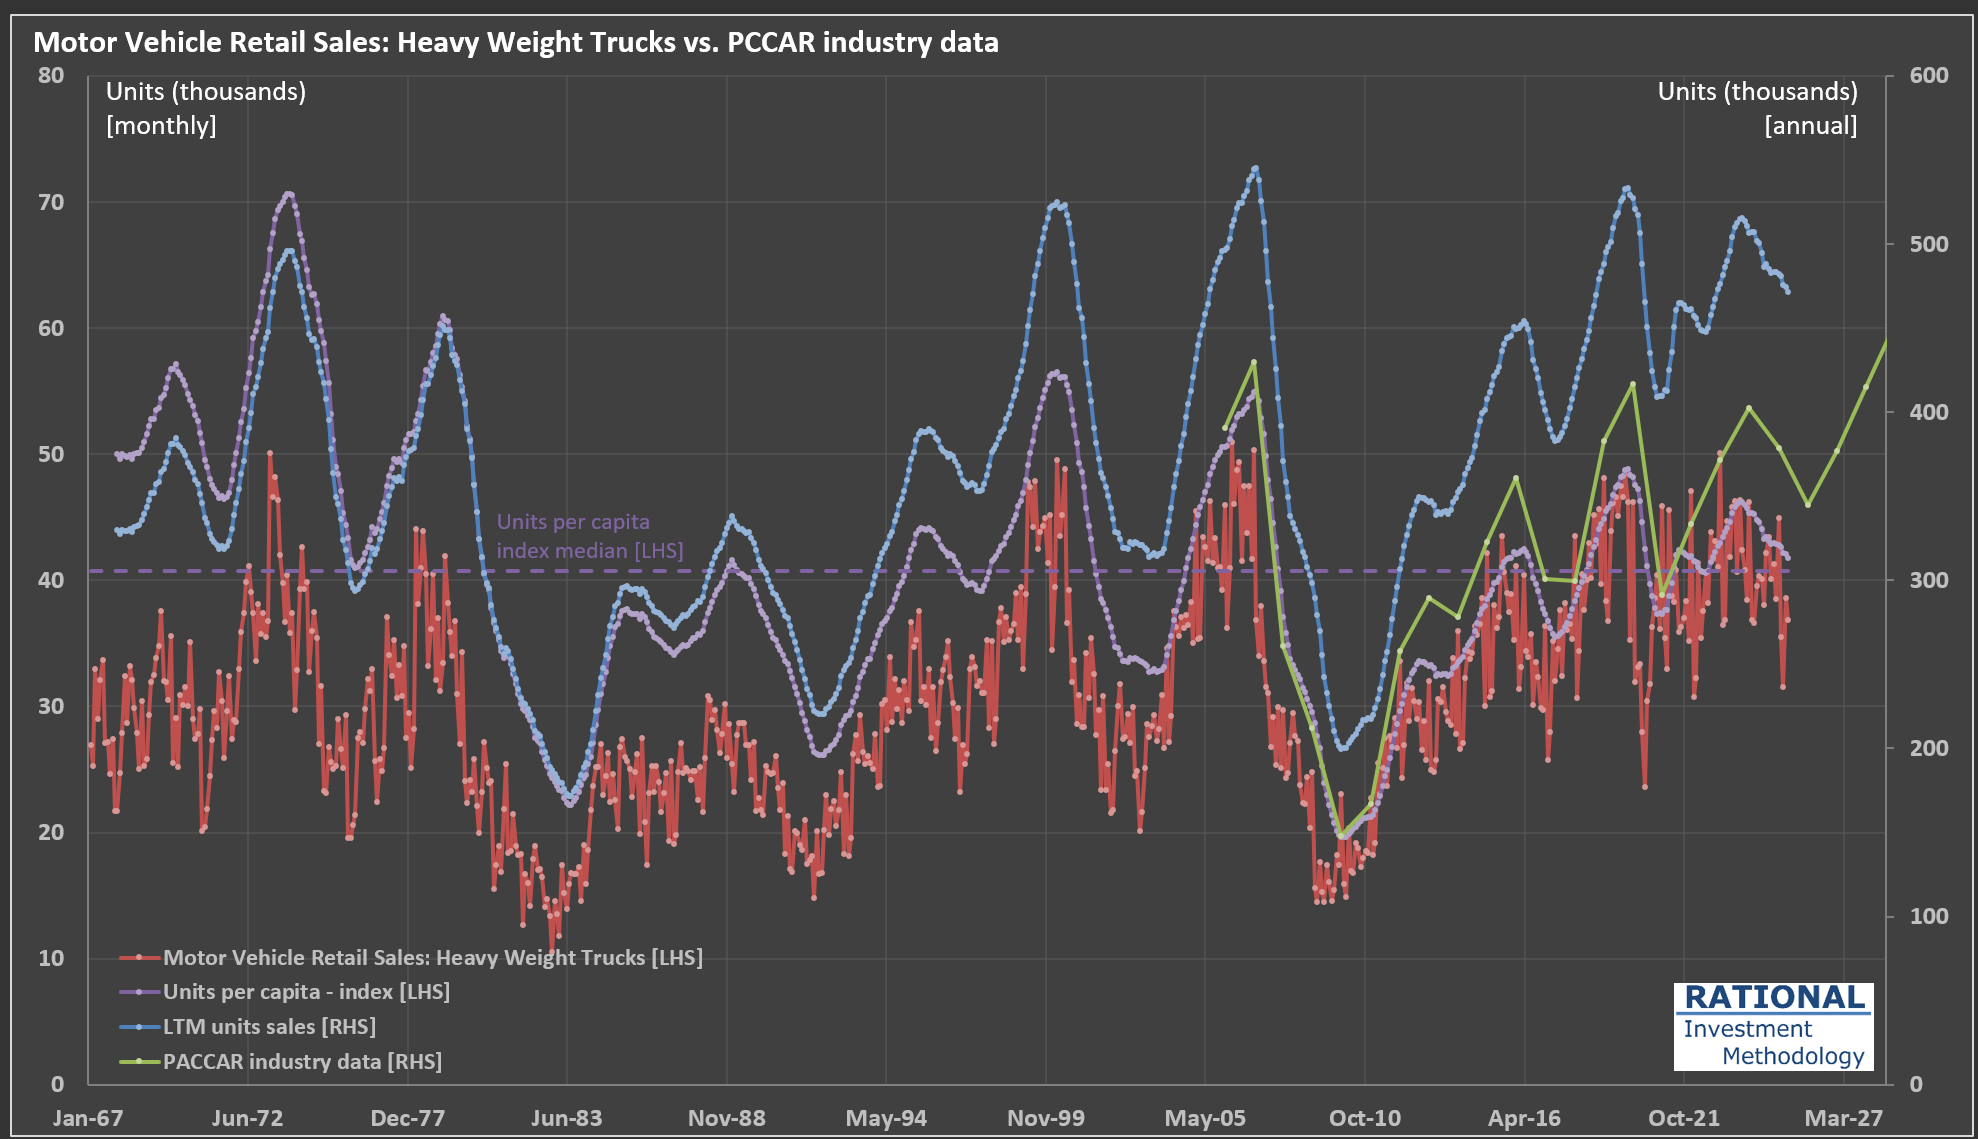
Take a look at the chart below:
The red line tracks monthly retail sales of heavy-weight trucks (in thousands of units, left axis). Because monthly figures can be quite volatile, I also include a rolling 12-month (LTM) sales figure—shown as the blue dashed line on the right axis (annualized, in thousands)—to help clarify the underlying cycle.
The green line represents PACCAR’s own industry data (also right axis). This closely follows the LTM sales trend, though there’s some divergence since PACCAR uses a slightly narrower market definition. Still, the correlation between the LTM data and PACCAR’s data is an impressive 97%, underscoring how similarly they reflect industry cycles.
Where does that leave us in the current cycle? The purple dashed line shows the units per capita index (left axis), which adjusts for population growth and offers a normalized view of demand over time. I’ve also marked the median value of this index on the chart, providing a useful benchmark to gauge whether current sales are running above or below historical norms.
At present, we’re in the second year of a downturn that began in late 2023. The pandemic era saw trucking companies enjoy strong profits, which led to a mini-boom in truck sales. Now, as we wait for 2Q 2025 earnings (due out in July), it will be interesting to see how the latest round of tariffs impacts the industry. Stay tuned.
