Census Bureau’s 2023 Data Points to Weaker Household Growth—A Closer Look
I’ve incorporated the US Census Bureau’s 2023 National Population Projections (you can explore the full dataset here) into my estimates of new household formation in the US. Typically, these revisions are minor—but not this time. Back in February, I highlighted the shrinking cohort of young families when discussing challenges for Carter’s ($CRI) in this post. The new projections, however, point to a broader slowdown in household formation.
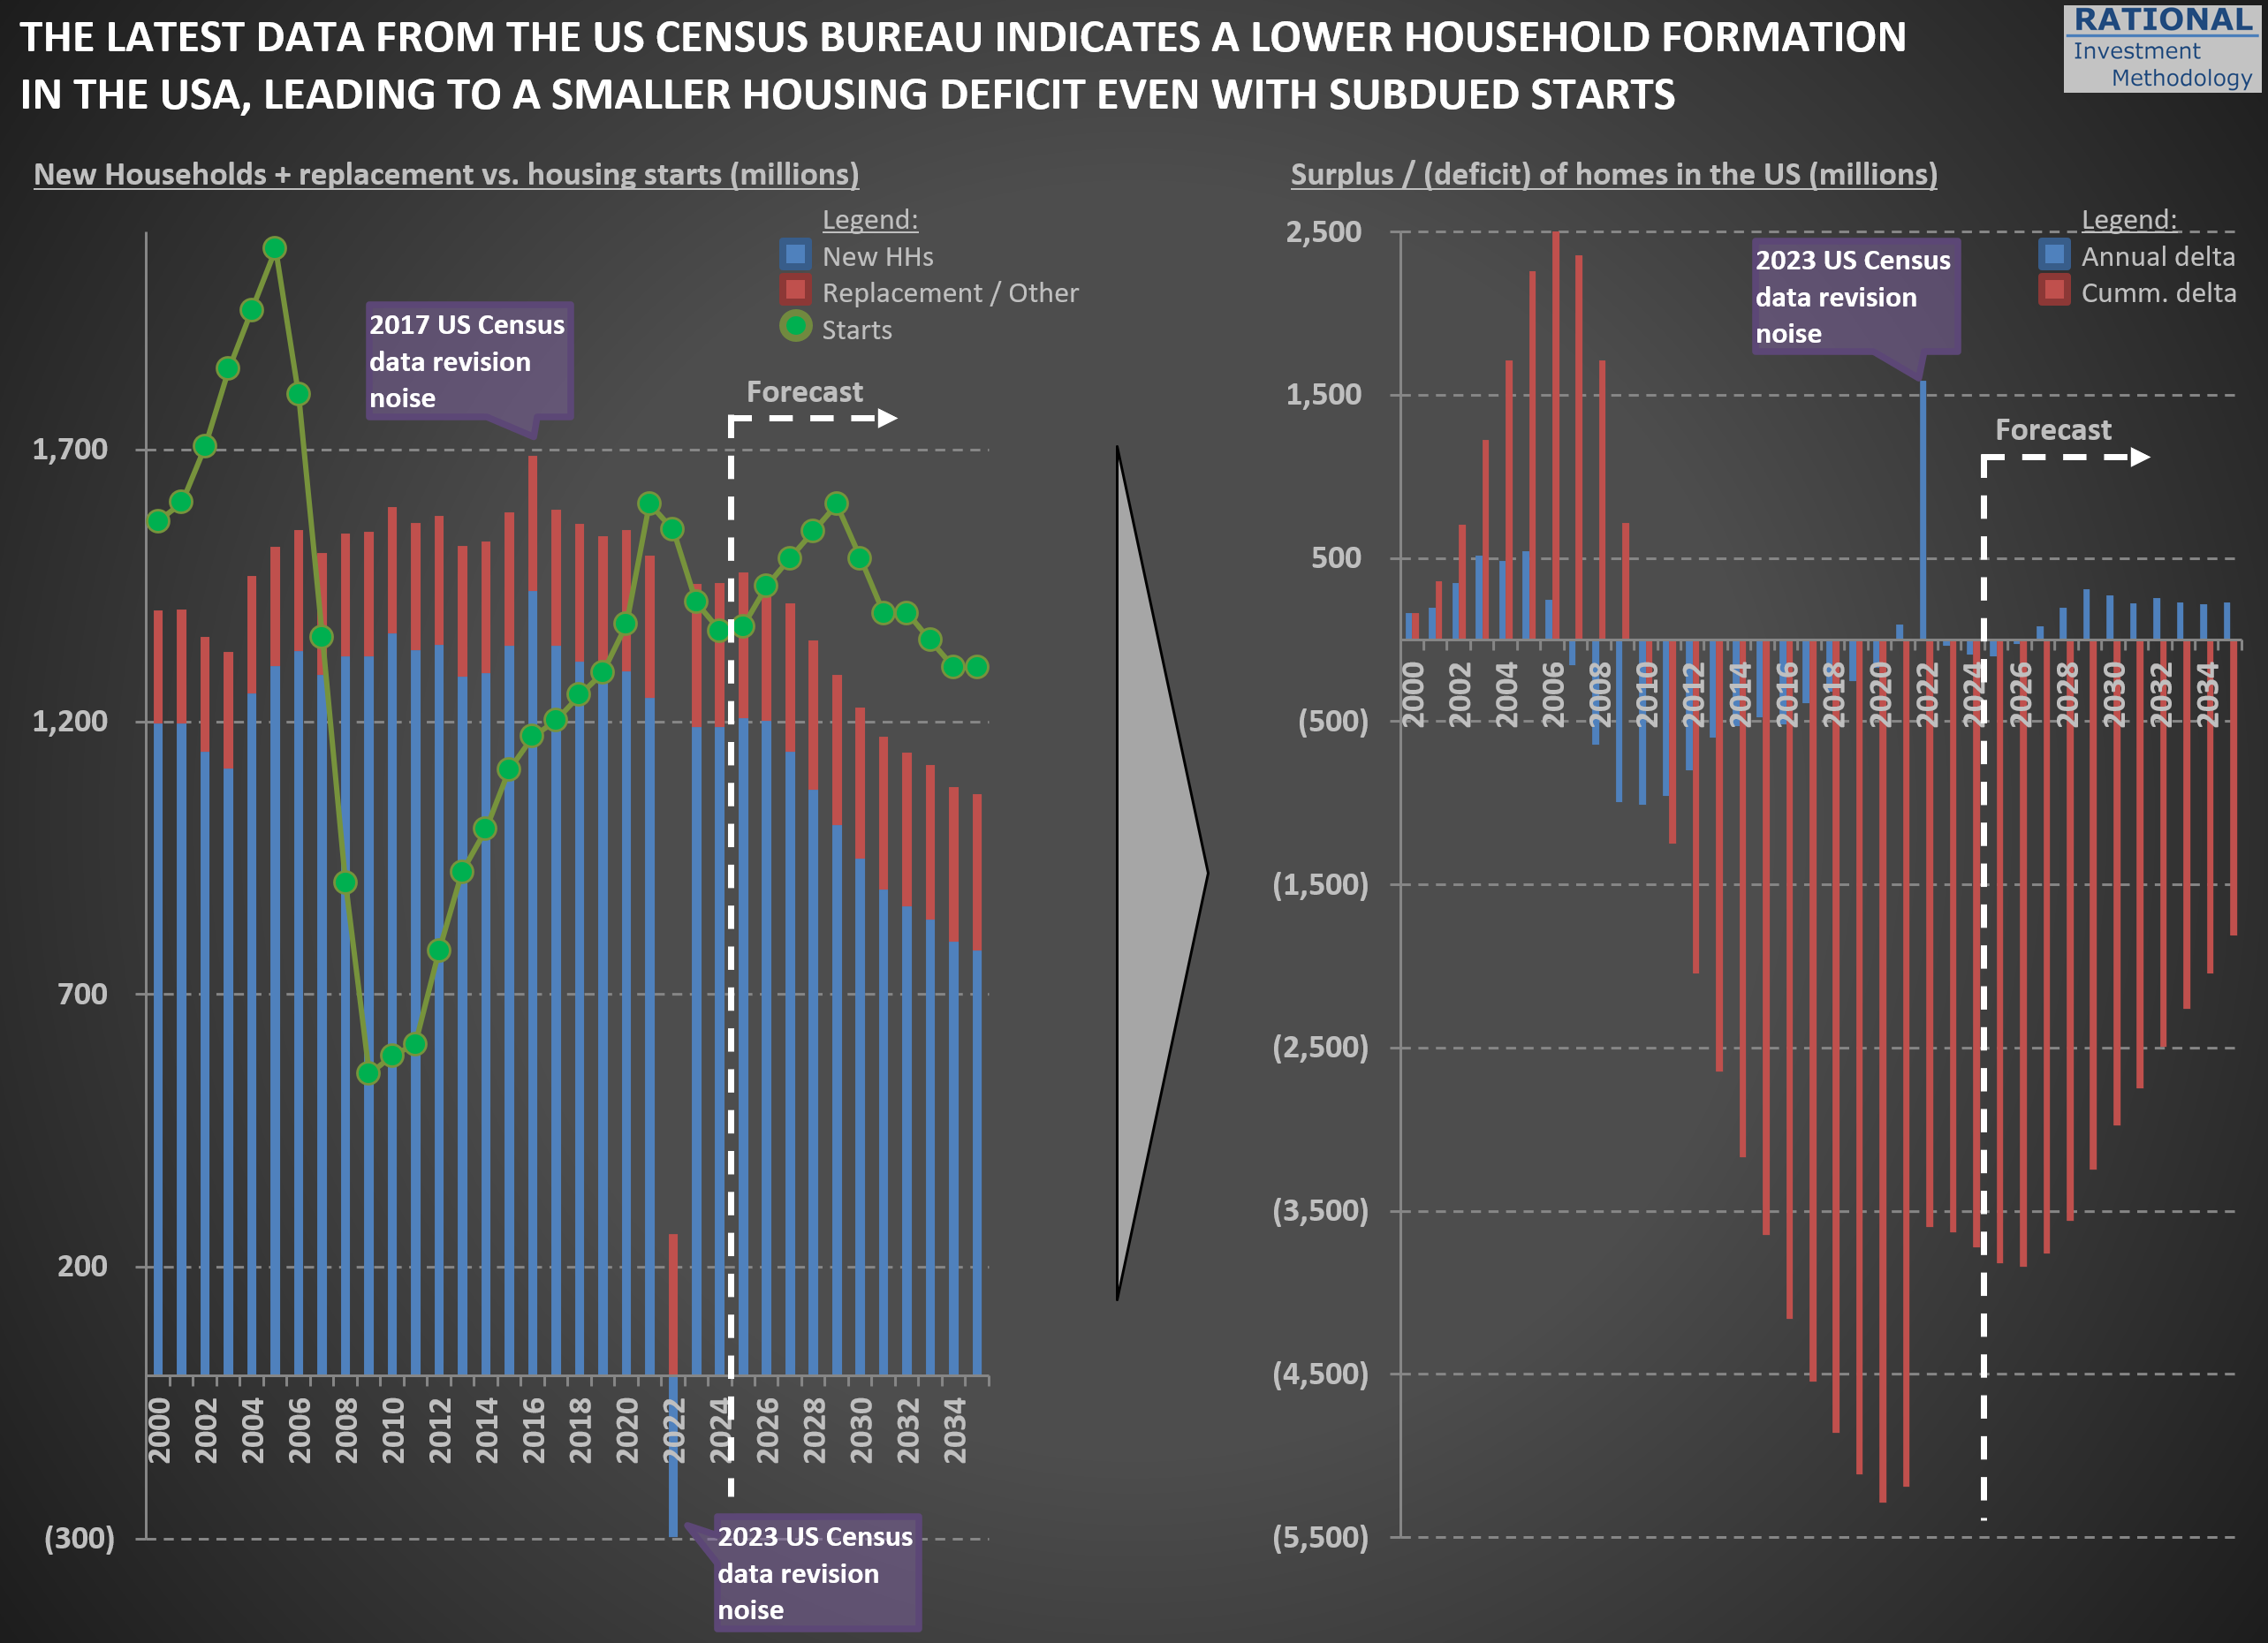
The chart below reflects these updates. First, you’ll notice a spike in “noise” around the 2022 figures (and a much smaller one in 2016). Although the data was published in 2023, the Census Bureau sometimes revises prior-year numbers—and I always use the most recent figures available, even for past years.
The key takeaway is that new household formation will grow much more slowly than it has over the past 25 years. That suggests future New Home Starts (green dots) may be lower than in recent decades. Even with subdued starts, any lingering home‐building deficit from the Global Financial Crisis will shrink significantly—so there won’t be a significant unmet demand waiting to be filled.
In my models, I’ve adjusted the normalized New Home Starts assumption from 1.5 million per year to 1.3 million per year. That change implies slightly lower long-term sales for housing‐related materials. While the valuation impact is modest—given how gradually this trend unfolds—it’s crucial to incorporate these shifting demographics when projecting decades‐ahead performance. I will also eagerly wait for data revisions given recent changes in immigration dynamics, as scenarios the US Census Bureau calls “low immigration” and “zero immigration” might become the new reality.
