
CofC: Consumer Staples - Food & Beverage
Why $HSY Defies Conventional Forecasting Wisdom
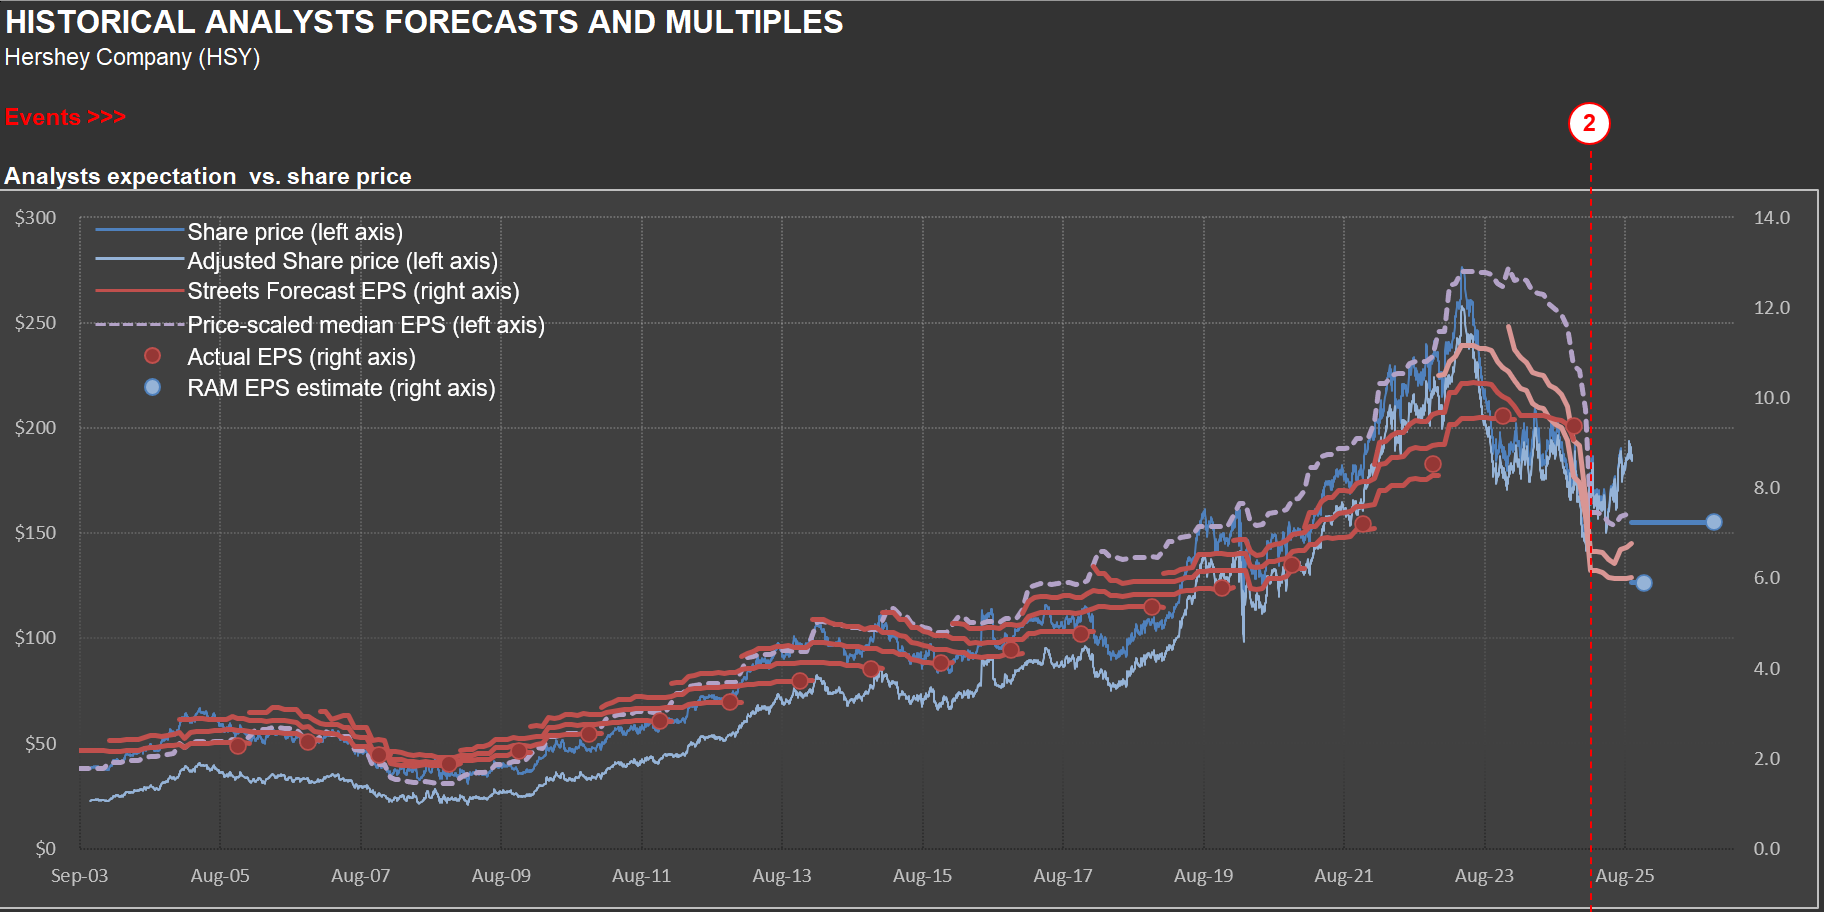
In early 2023, Hershey’s shares were trading near $275—the same vicinity where RIM’s short position kicked off (the position has since been closed). By Q1 2025, they’d slumped below $150, underscoring the perils of overconfidence in a seemingly stable business. Nowhere was this more evident than in 2Q 2024, when Hershey reported its worst quarterly sales decline in twenty years: a steep −16.7%.
Management broke down the drivers of that plunge as follows: ERP-driven inventory cuts (approximately 9 points), retailer timing shifts (approximately 6–7 points), discretionary spending pullback, channel migration, merchandising cuts, and category softness.
Just as sales surprises can upend forecasts for a chocolate maker, cost fluctuations add another layer of uncertainty. In 2Q 2025, Hershey’s adjusted gross margin plunged 510 basis points, driven by cocoa price spikes, elevated manufacturing costs, and tariffs. Those headwinds largely offset price increases, productivity gains, and transformation savings. Looking ahead, management projects full-year gross margin erosion of 675–700 basis points—an eye-watering swing that few analysts anticipated twelve months prior - the chart above shows how fast earnings were revised down (dragging with it HSY’s shares).
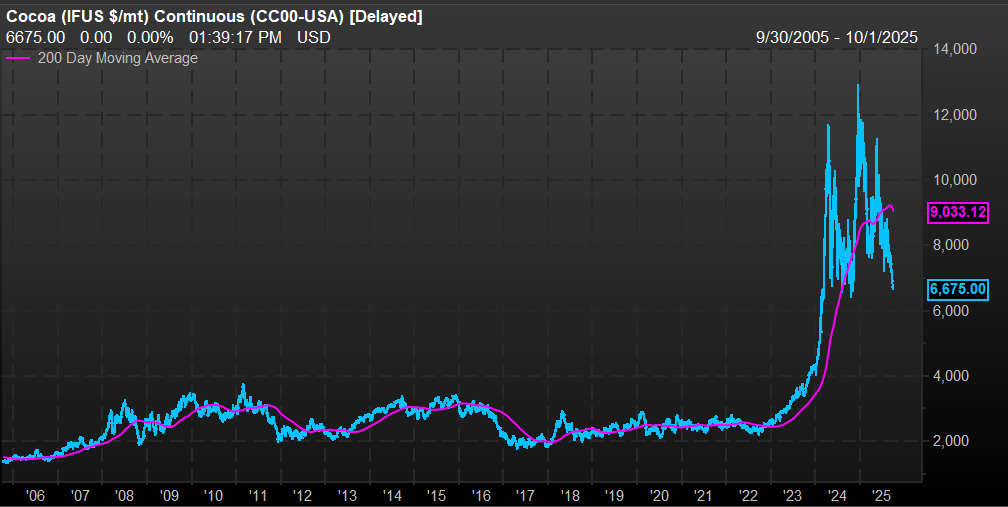
The Hershey’s saga offers a cautionary tale for forecasting any business: even “mundane” companies confront complexity at every turn, exposing how little control companies might have over outcomes. A case in point is the price of cocoa (see the second chart). Prices surpassed $12,000 per metric ton in late 2014, from an average of around $2,500 per metric ton in prior years. Hershey uses derivatives to try to control commodity price volatility, but something of that magnitude, impacting the most important commodity used in their manufacturing process, can’t be neutralized.
If projecting Hershey’s sales and profits—with its nearly century-old brands and predictable seasonality—can trip up analysts, imagine the challenge of forecasting fast-evolving technology ventures. So approach new and uncharted territories carefully.
Seeing Through Currency Noise: Interpreting $PEP Sales Trends
In many of my sales charts for companies with significant international exposure, I include a “USD index”—like the orange line on the chart below. In this case, the chart is for $PEP (PepsiCo). The annotations and text box on the chart highlight periods of substantial change in the USD’s value versus a currency basket (I use the DXY, which includes the EUR, JPY, GBP, CAD, SEK, and CHF). The accompanying table below the chart details the specific dates and quantifies the total and annual appreciation or declines during each cycle.
The index is “inverted,” so it moves higher as foreign currencies strengthen against the USD. It means that when the orange line rises, companies like Pepsi—which report sales in USD—get a boost from currency translation on their international sales. Conversely, when the line declines, it acts as a headwind for reported international sales.
I don’t use this chart to make predictions. Instead, it’s a tool for context. If international sales, reported in USD, look strong, it’s worth checking whether this is due to real underlying growth or simply a weaker dollar. That was certainly the case in the early 2000s. But since mid-2008, the USD has strengthened considerably against other major currencies, so international sales growth, in USD terms, has slowed or even reversed.
Last, there’s been plenty of commentary in 2025 about the “unprecedented” weakness of the USD. While there’s some truth to that, the DXY index is not far from its late-2016 peak—and, in fact, the USD only reached a higher high (represented by a lower point for the orange line) in 2022.
The takeaway? It’s essential to maintain a long-term perspective on FX rates. As the table below demonstrates, cycles of appreciation and depreciation can persist for many years (see the years and months for each cycle listed in the table).

