Less cars but higher sales in real terms? Inflation confusion at play
After finishing my $AAP (Advance Auto Parts) work, I’m updating my analysis on $ORLY (O’Reilly Automotive). The difference in performance between these two stocks is staggering, but—given current price levels—you might be surprised which offers materially better prospects for higher IRRs (Internal Rate of Return) for the long-term holder.
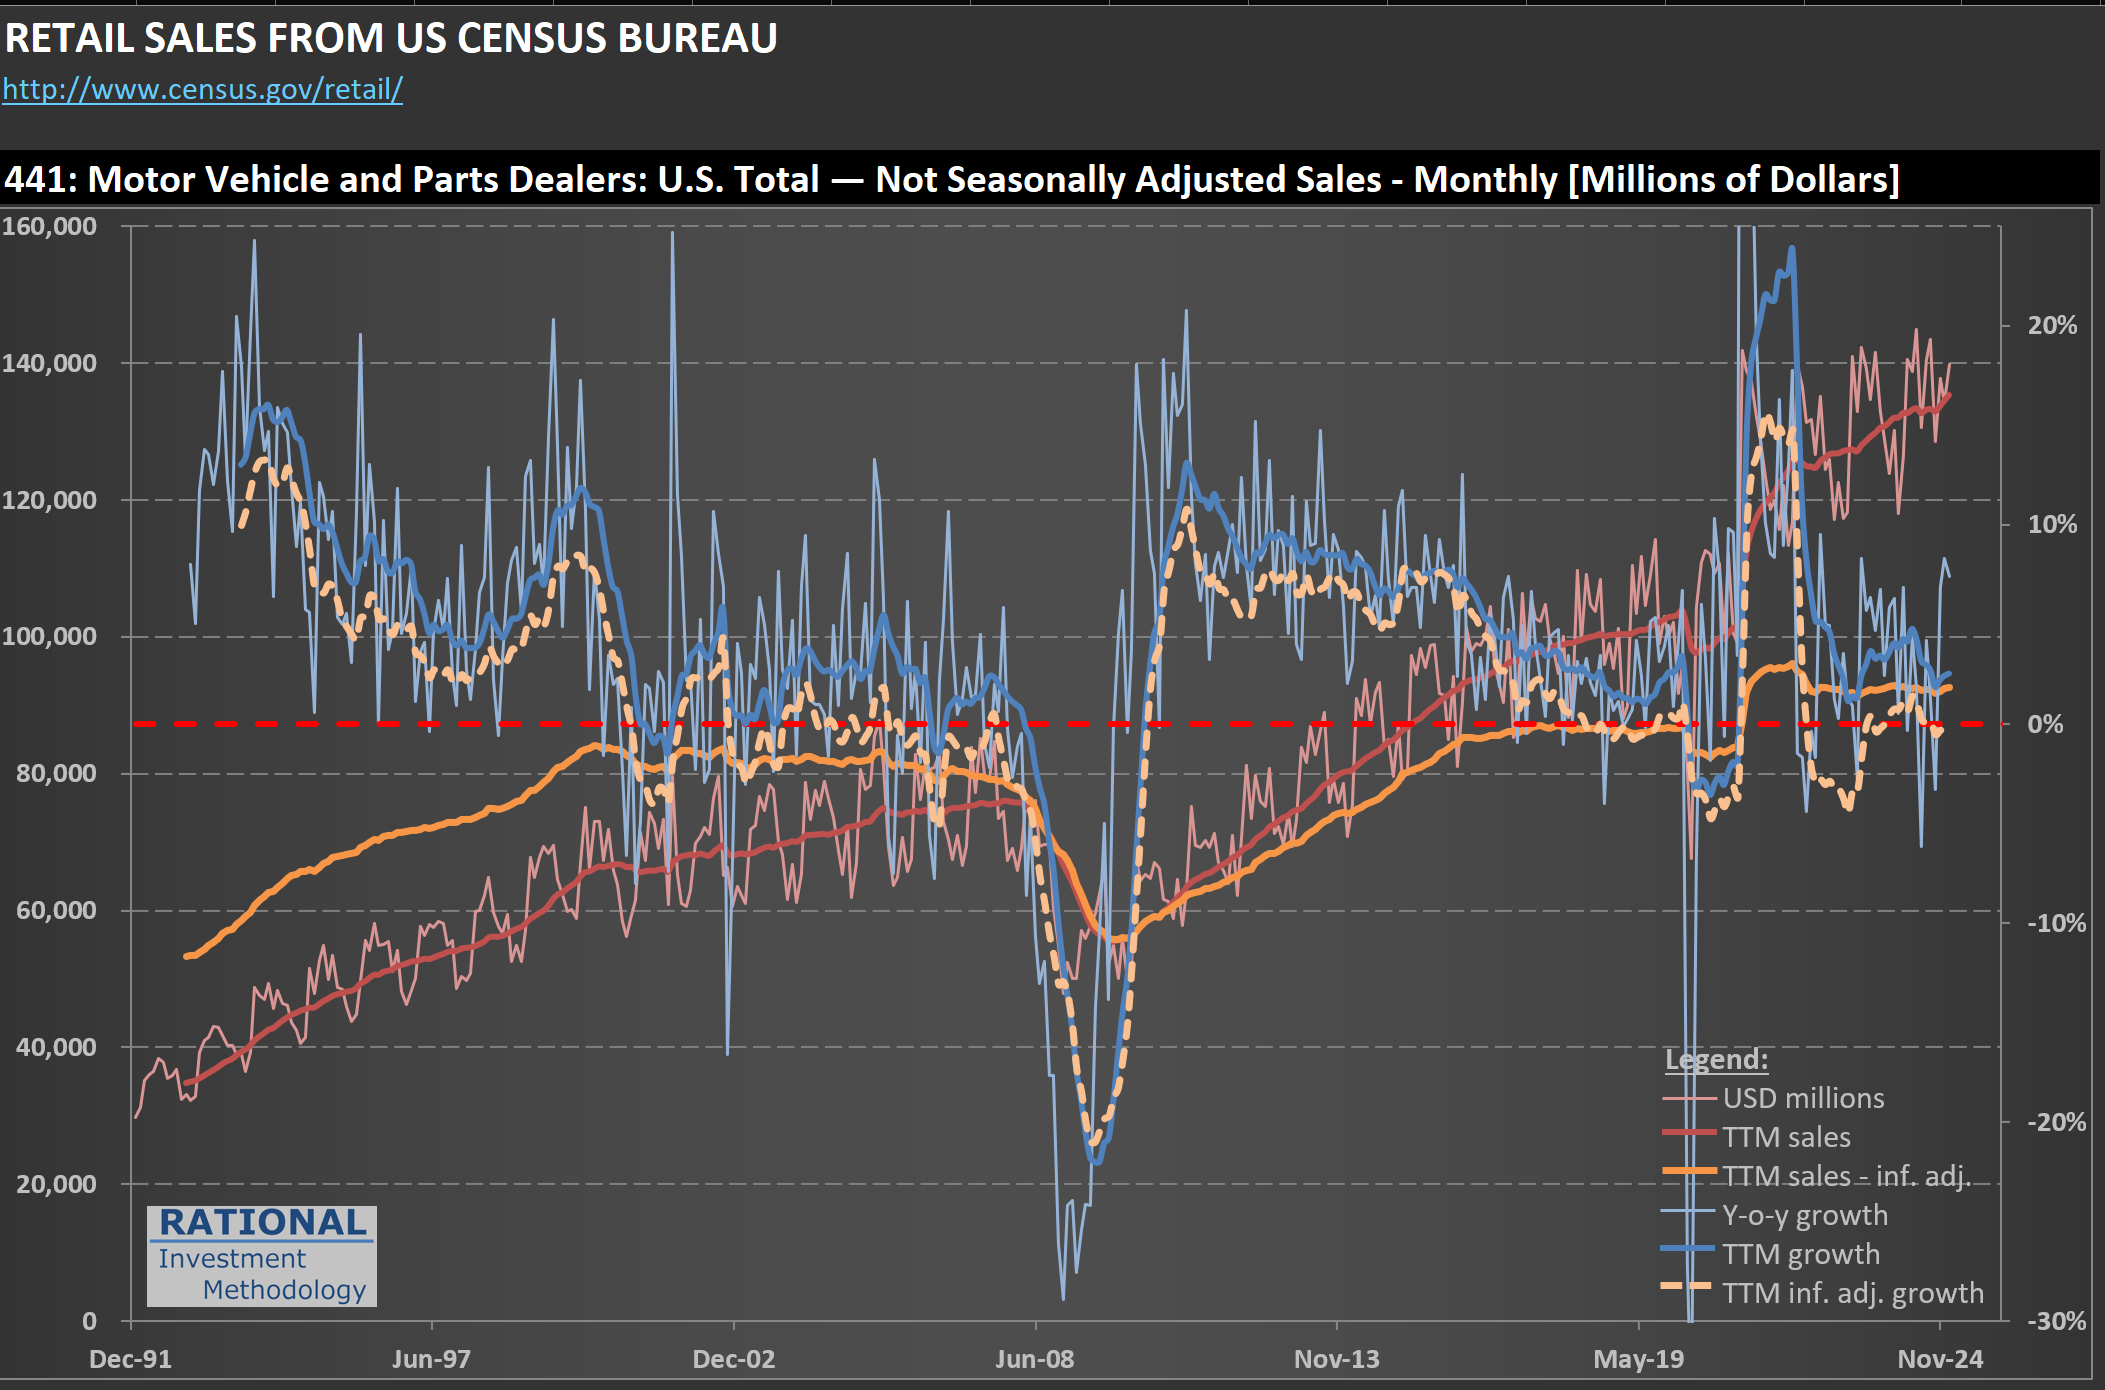
The chart I’m sharing below offers a high-level view of motor vehicle (and parts—a small part of these figures) sales. The line to focus on is the orange one: it shows sales adjusted for inflation. Now if you look at the last post (here) showing the number of vehicle sales, you will see a discrepancy. I.e., the number of vehicle sales is lower (by -7,5%) while the total dollars spent is higher (by +6.4%) compared to pre-pandemic levels.
A change in mix (more expensive cars, less cheap cars) could explain part of the delta. But another factor is at play: the overall inflation ratio (which I use to normalize sales) doesn’t capture the actual inflation in car prices. These more expensive (in real terms) cars lead to lower unit sales than before. It doesn’t help that the American consumer is also in a recession - I discussed it on a post yesterday (here).
