Valuation Distributions: Why 'Is the Market Cheap?' is the wrong question and how to use it to spot recessions
Frequently I’m asked if I think “The Market” is expensive or cheap. I know the person asking the question wants a yes/no answer. Still, I must explain that - although you could provide a single number - it would be a very incomplete as any market is a distribution of under/over valuations of all the companies in that market. So if you want to know if the S&P500 is cheap/expensive, you have to have an assessment of the under/over valuation of 500 companies!
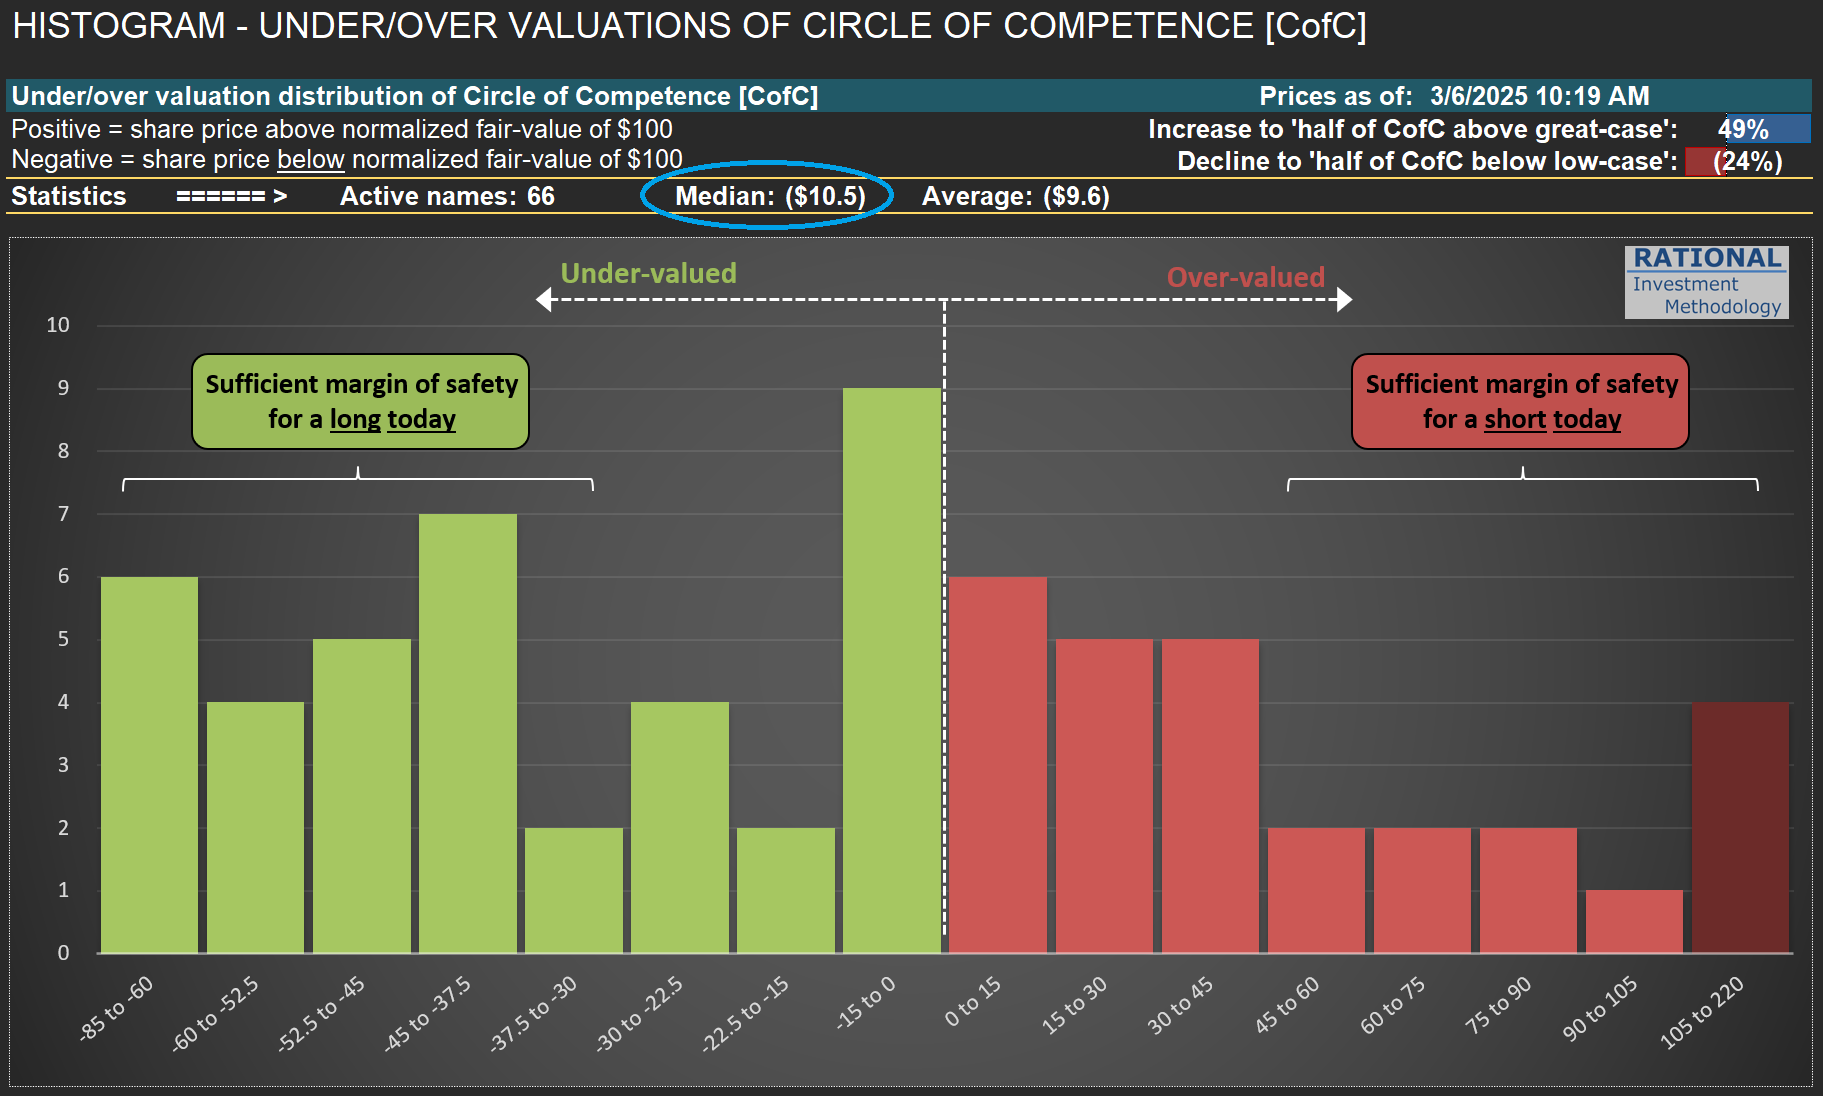
What I do day in and day out at RIM is to update and polish reference fair values for all the companies on my CofC (Circle of Competence). By normalizing these fair values to $100/share, I can build the histogram in the first picture below. So for “RIM’s market”, the average company is undervalued by ~10% (see figure circled in blue on the chart). But this is an average. Reality is much more complex - some companies are cheap while others are expensive. Hence, it is crucial to see the data in a histogram.
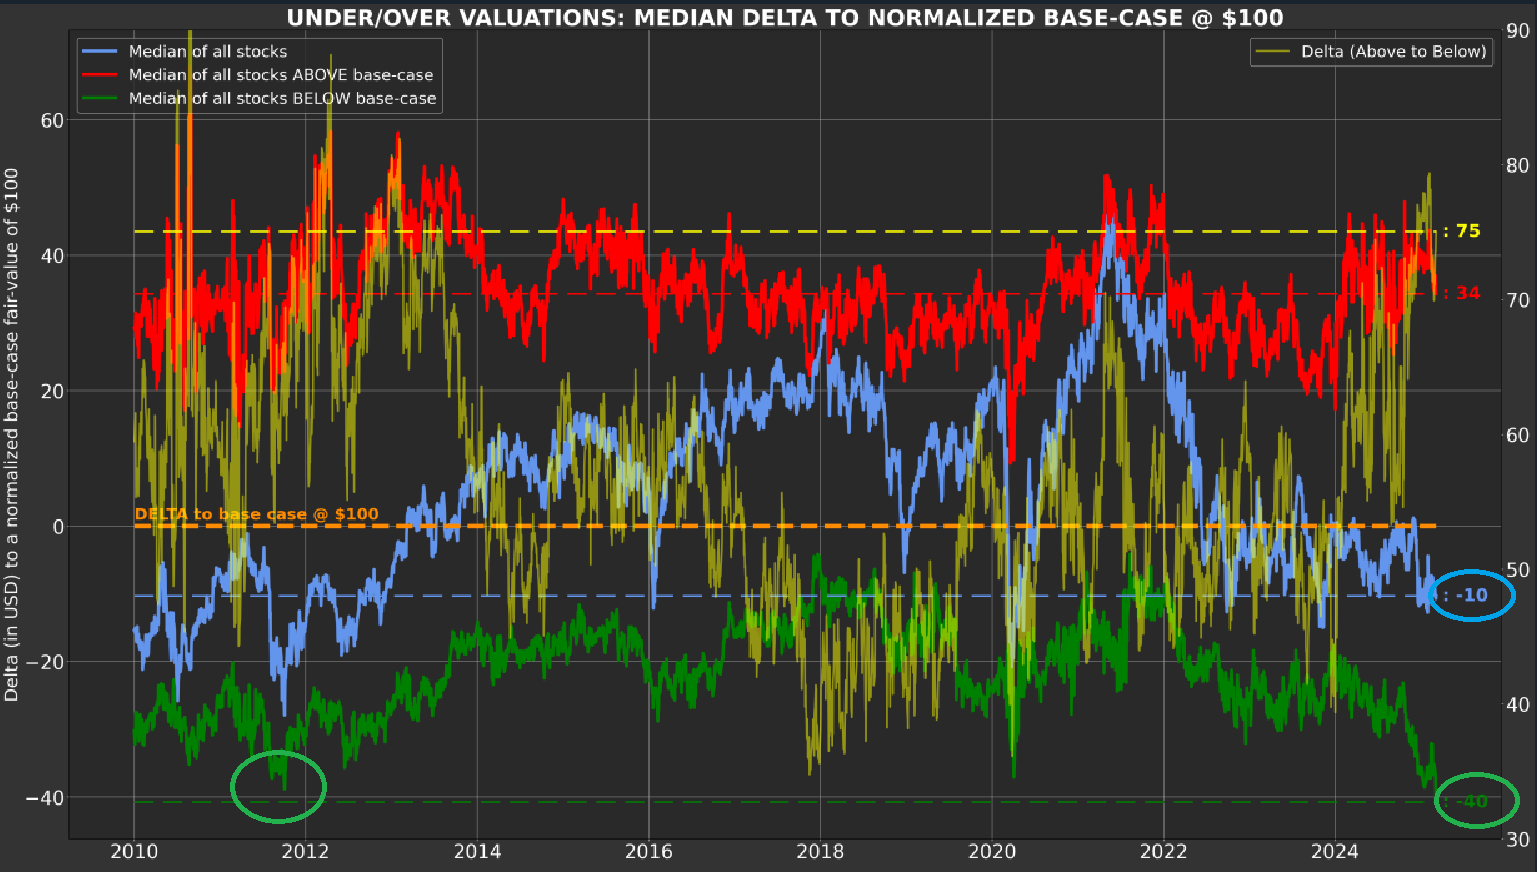
But we can do better (as long as you have a sophisticated tool like Odysseus - RIM’s portfolio construction, trading and reporting tool). Take a moment to review the second chart below. It shows the averages, over time, of all companies (in blue), the expensive ones (in red—they are also in red in the histogram), and the cheap ones (in green—they correspond to the ones also in green in the histogram).
I want to bring to your attention the green line—cheap companies are now undervalued by 40%! See the -40 figure circled on the right side of the chart. This is more extreme than what was observed in the summer of 2011 (period circled in green). Can it get worse (i.e., more undervalued)? Of course - the second chart starts in 2010 because I want to exclude 2009, as undervaluation at that period was almost surreal. But understand this - the US is in a full-blown recession for some industries. Look at the post I did for $BC (Brunswick) here and $HOG (Harley Davidson) here. Sales figures at these industries (per capita) are at 2009 levels. The same is true for anything discretionary, from mattresses to toasters.
So, are we in a recession? I won’t debate potential distortions to broad GDP figures—that define whether the country is in a recession or not—with its multiple adjustments, as macro-economics is not my specialty. However, the American consumer is definitely in a recessionary mood. That is why we have so many cheap stocks (and by an uncommon amount) - they are primarily in the consumer/housing segments.
Last, you can see that the red line on the second chart is still relatively high. That is because some industrial names, which have a delayed cycle compared to consumers, are only now showing a substantial correction in sales and margins. However, valuations in the sector will eventually reflect the harsh reality for some companies in this group.
So what should one do out of this long blog? I hope it will help by reminding you to discuss more precisely what it means to say “the market is expensive” (or cheap). I want you to think about distributions. Moreover, also to think about the possibility of someone really having an assessment for all the companies that are part of whatever market they are referring to. So next time someone tells you “I think the S&P500 will go up” (implying they think it is cheap), you can tongue-in-cheek say “Wow, I didn’t know you had 500 valuations!” Otherwise, any opinion is nothing more than a blind guess.
Farm Cash Flow: The Hidden Driver of Agricultural Equipment Sales
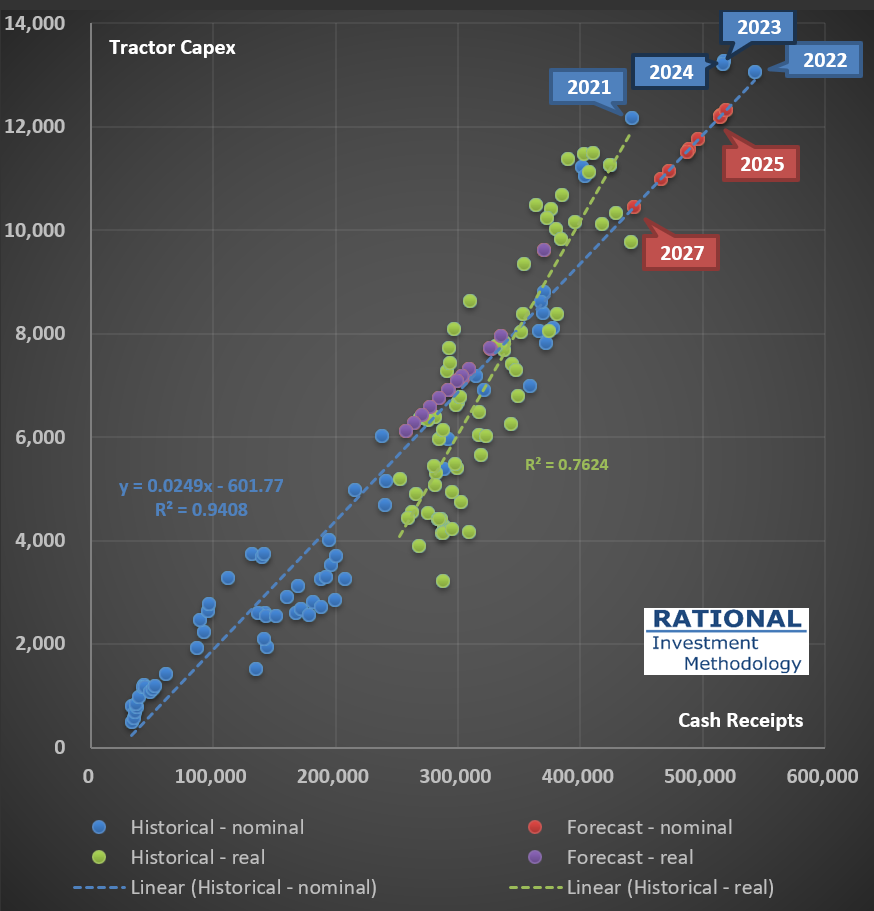
As I delve into my $AGCO [AGCO Corporation] analysis today, I’m reminded of the fascinating relationship between farm economics and agricultural equipment sales. The agricultural sector’s financial health, particularly U.S. farm cash receipts (or net cash income), has historically been a key indicator of agricultural capital expenditures.
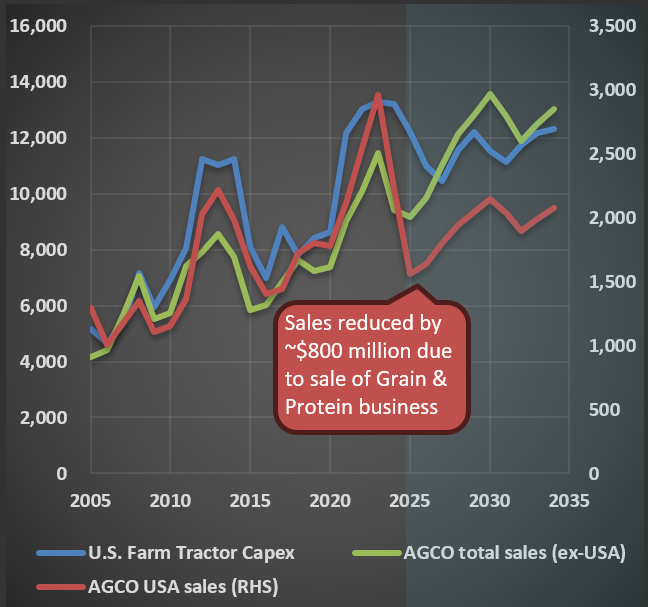
Take a moment to examine the first chart below. It beautifully illustrates the strong correlation between tractor sales and cash receipts, highlighting the direct impact of farm profitability on equipment purchases.
Even more intriguing is how we can use U.S. farm cash receipts as a proxy for global trends. Despite AGCO and other agricultural equipment companies operating on a global scale, the interconnected nature of agricultural commodity markets allows for this simplification. The second chart demonstrates this phenomenon, showing remarkably similar sales dynamics between U.S. and non-U.S. regions.
In my forecasting work, which includes $DE [Deere & Co.], I’ve found the USDA’s projections of U.S. farm cash receipts to be invaluable for predicting long-term revenue trends in the agricultural equipment sector. This approach has consistently yielded accurate results, providing a solid foundation for investment decisions.
Market Prices vs. Fair Value: Why Today’s Quote Isn’t the Full Story
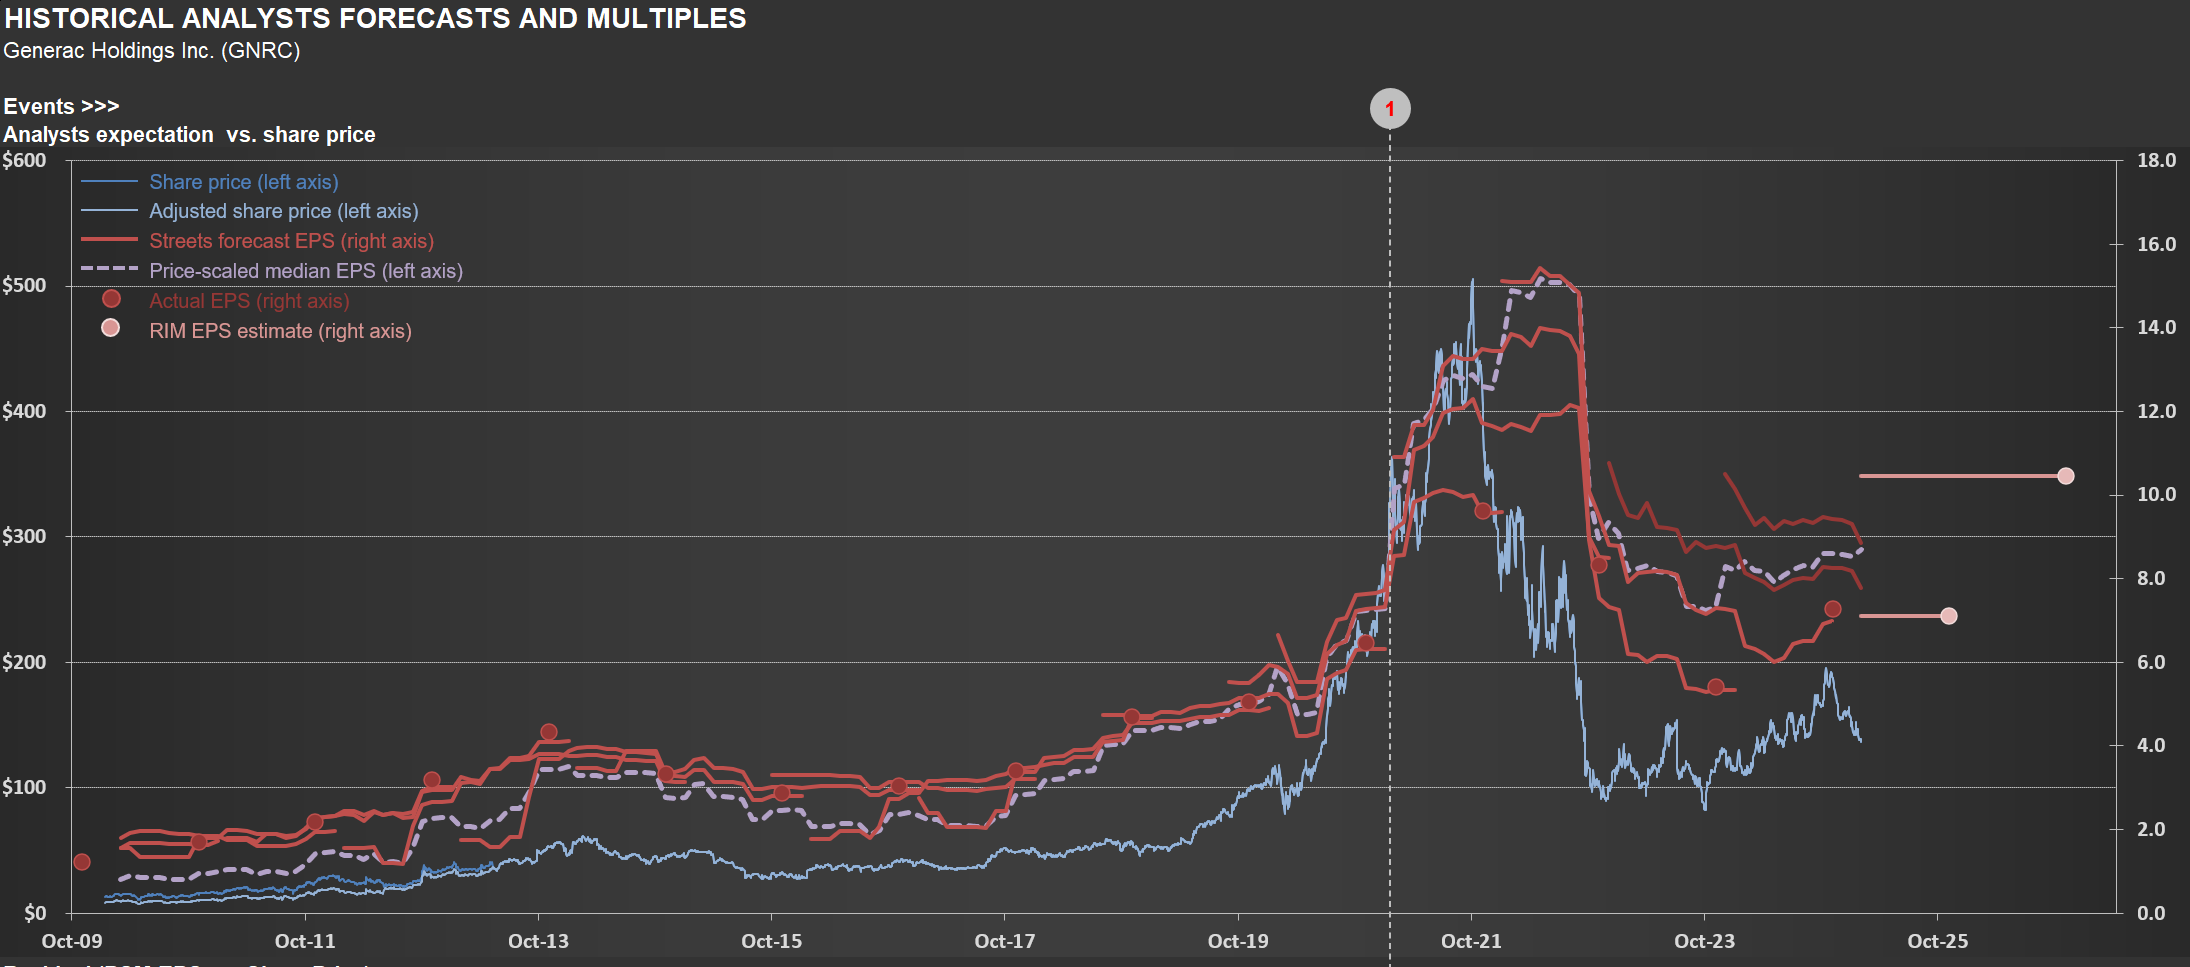
When assessing a company’s long-term value, certain metrics can be misleading—and today’s share price often tops the list. Take $GNRC [Generac] as an example. Since its IPO, short-term earnings estimates (red lines in the first chart below) have closely tracked its share price (blue line). While markets are “correct” on average over time, valuations at any given moment frequently stray far from rational estimates of fair value.
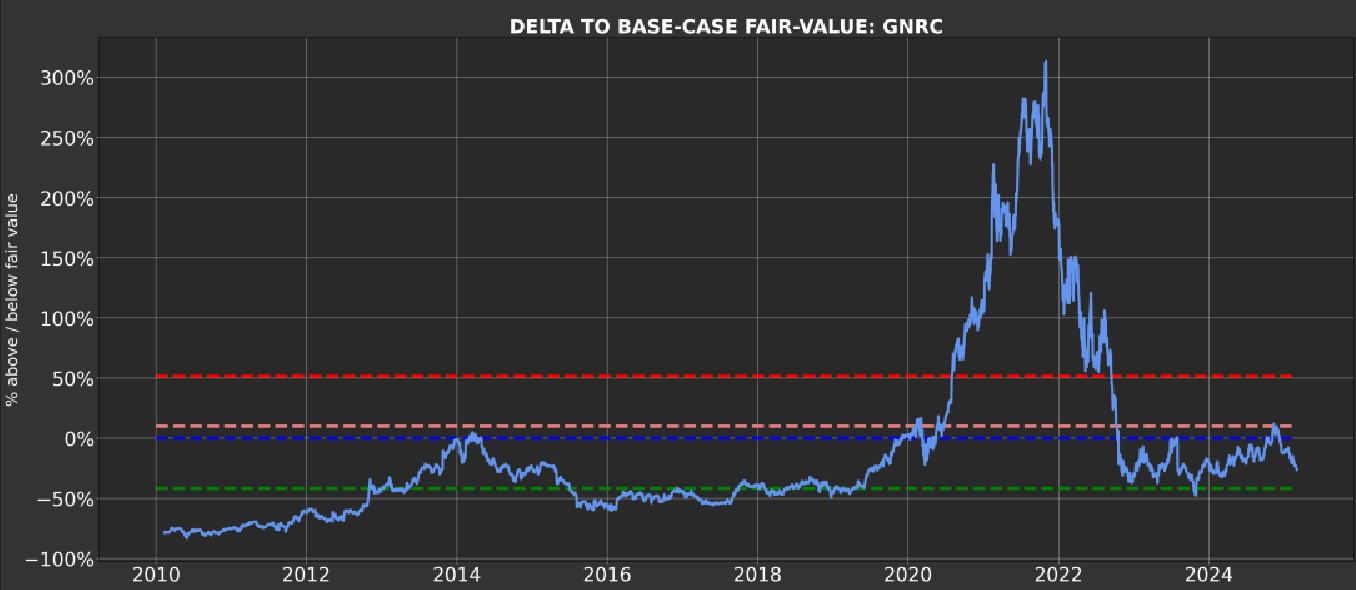
The second chart, from Odysseus (RIM’s portfolio management tool), highlights this disconnect. The blue line shows the market price deviation from RIM’s fair value calculation. At $500/share in late 2021, Generac traded at a staggering 300% premium to its intrinsic value—a vivid reminder that asking “what is the market telling me?” can lead to flawed conclusions.
Key Takeaways:
- Extreme price deviations are common, driven by short-term sentiment rather than long-term fundamentals.
- Systematic strategies thrive on these dislocations, using disciplined triggers to enter long/short positions.
- RIM’s approach focuses on exploiting these gaps rationally, avoiding emotional reactions to market noise.
By anchoring decisions to intrinsic value—not fleeting price swings—investors can turn volatility into opportunity.
Recreational Boating Market Hits Recession-Era Levels
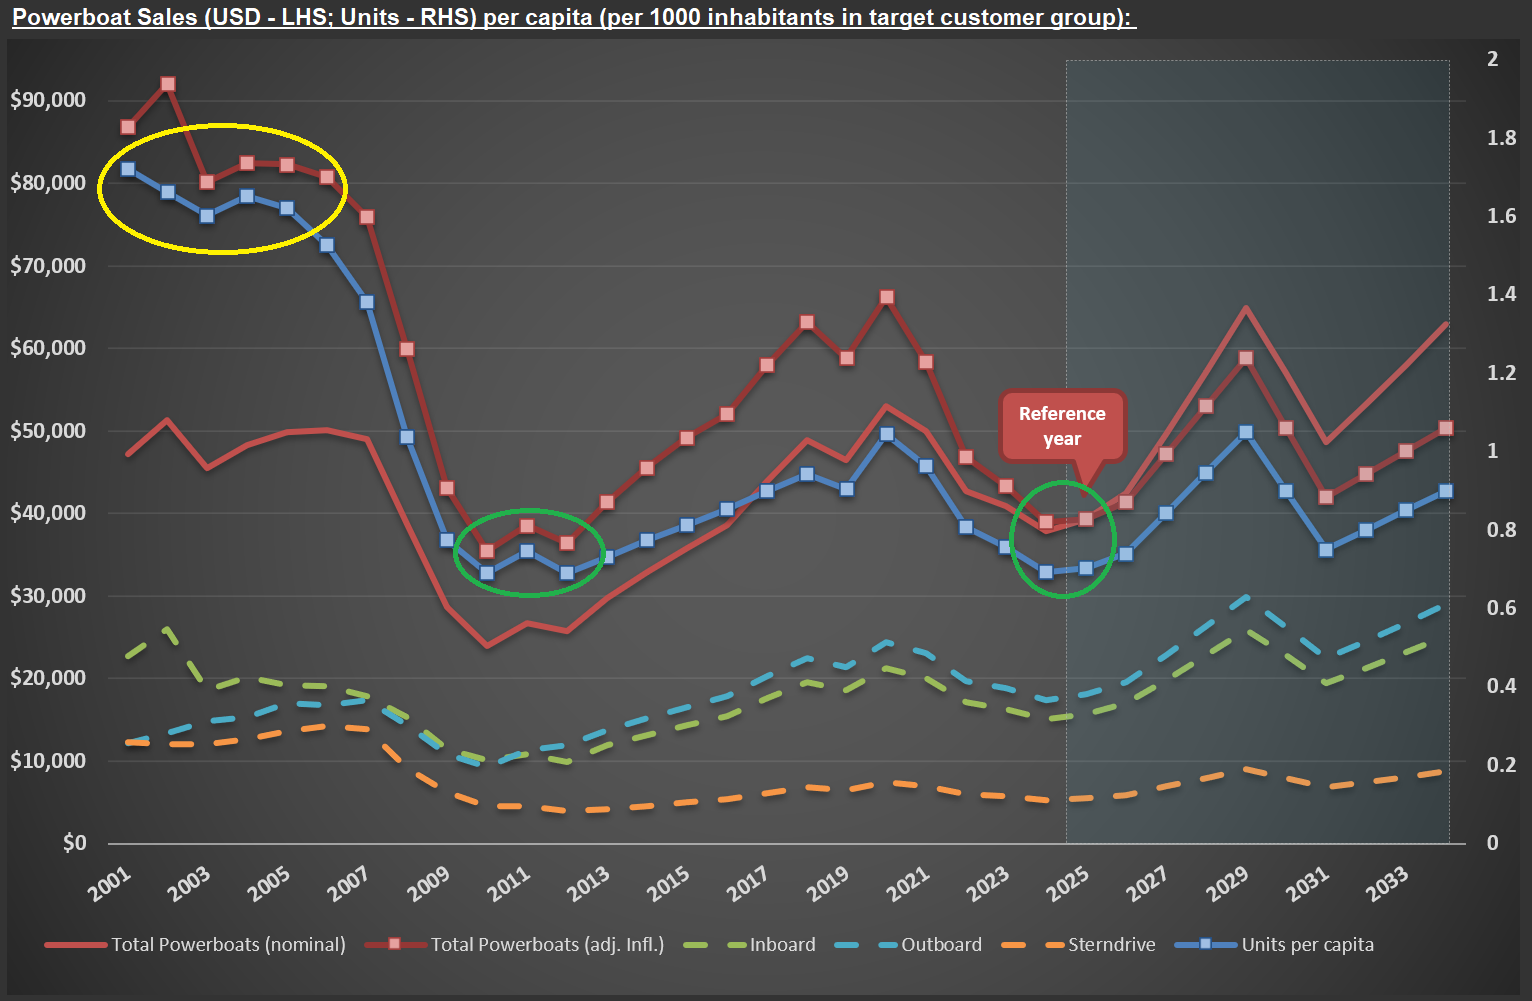
The recreational boating market reveals some concerning trends (which might lead to buying opportunities in the sector). The chart below shows powerboat sales estimates from my $BC (Brunswick) analysis, with the square-marked lines telling an important story. Sales volumes for 2024/2025, measured in units or inflation-adjusted dollars, have retreated to levels we haven’t seen since 2010-2012 – the early recovery period following the Great Recession (circled in green). Even more striking is how these figures compare to the pre-housing bubble era that ended in late 2005 (circled in yellow).
While headline GDP numbers might suggest economic health (I’ll share updated GDP charts and some comments in a future post), the recreational boating industry is experiencing significant challenges. This disconnect between broad economic indicators and sector-specific realities is worth noting for investors.
Brunswick’s recent actions highlight these difficulties. During their Q4 2024 conference call, the CEO candidly shared: “If you look from 1 January 2024 to 31 December, we unfortunately had to exit about 20% of our hourly staff and 7% of our salaried staff. The majority of that happened in the back half of the year when it was clear that we had to reduce our production levels to support year-end inventory levels that we needed to go into 2025.”
What does this mean for the broader discretionary spending landscape? I believe the American consumer is currently in a recession, as comments like the one above - and figures shown in the picture below - don’t show up during a healthy economy. But as always, this too shall pass, and Brunswick and other companies in the sector will revert to normalized sales levels.
America's Declining Motorcycle Market and What It Means for Harley Davidson
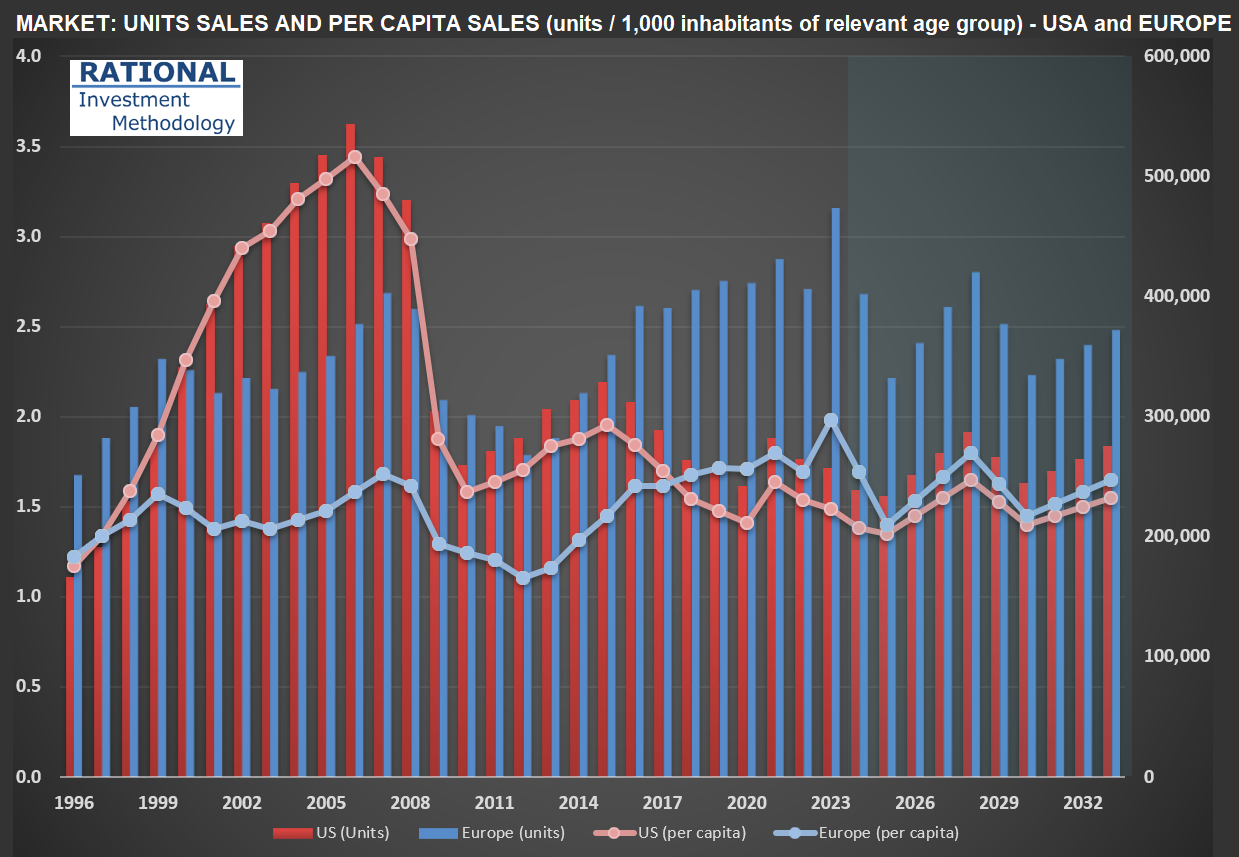
Bloomberg is conducting a comprehensive series of special segments on $HOG [Harley Davidson], highlighting significant shifts in the American motorcycle market - hence this post. The evolution of motorcycle sales per capita in the United States has shown a staggering decline over recent years, as illustrated in the chart below.
Surprisingly, Americans now purchase fewer large motorcycles (over 600cc) than Europeans, despite having advantages that traditionally supported motorcycle ownership: abundant open spaces for riding, widespread garage availability for storage, and higher income per capita. This represents a fundamental shift in the American motorcycle culture that Harley Davidson has long dominated.
As part of my ongoing analysis of recreational vehicle markets, I’m currently researching $BC [Brunswick Corporation], a leader in the marine industry. I’ll be sharing insights on the boating sector soon, examining whether similar consumption pattern changes are occurring across different recreational vehicle categories.
Carter's 2025 Forecast vs. Reality: A Humbling Lesson in Long-Term Guidance
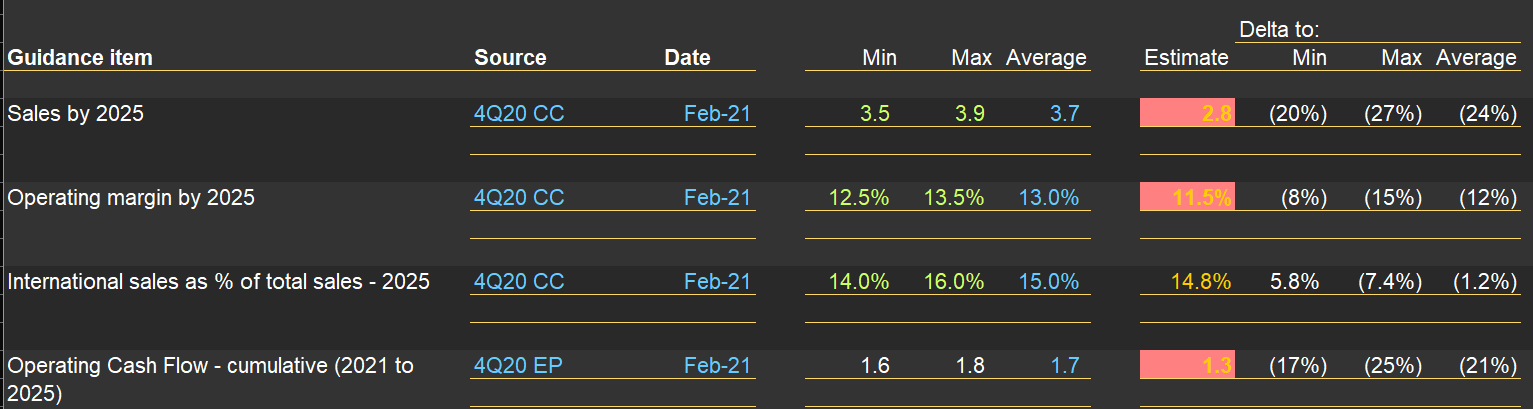
Companies usually provide “guidance” for short term expectations. It helps when there are more complex changes in the P&L (for instance, after an acquisition and/or disposal). But sometimes, they provide longer-term guidance, as did $CRI (Carter’s) management in early 2021. The picture below shows their guidance for 2025 (on the left). On the right, what might happen (as we are now entering the “target year”). The delta between expectations vs. reality is significant (and I’m using a “normalized margin” for 2025 - the actual is expected to be closer to 7%). This example underscores how difficult it is to make forecasts. If it is that hard for a company’s management team that sells baby clothes, founded 160 years ago, can you imagine your chances to forecast sales and profitability in the technology field correctly? If you want to invest (instead of speculate), focus on mundane businesses. And even so you will be humbled by your mistakes!
US Census Bureau Revisions Shrink America's Youngest Population: Implications for Carter's Future Market
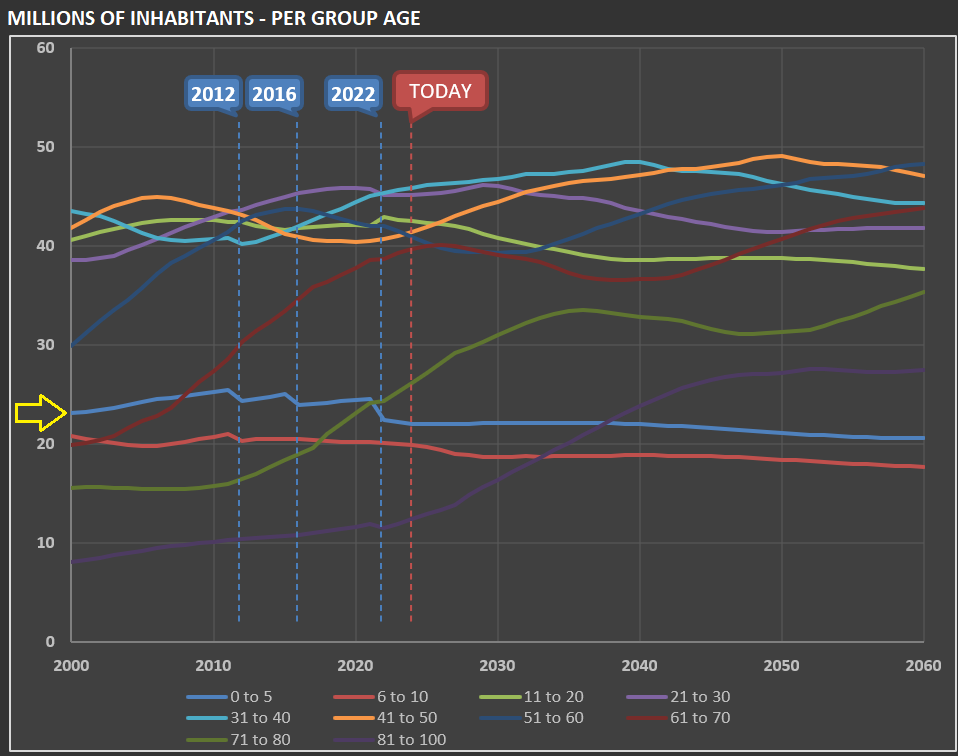
When I’m working on $CRI [Carter’s], I need to update the forecasted population growth for the “zero to 5” segment in the US (done by the US Census Bureau), as they are the company’s core “clients.” The first chart below shows—per various group ages—how many millions of people the US has had and is expected to have over the next few decades.
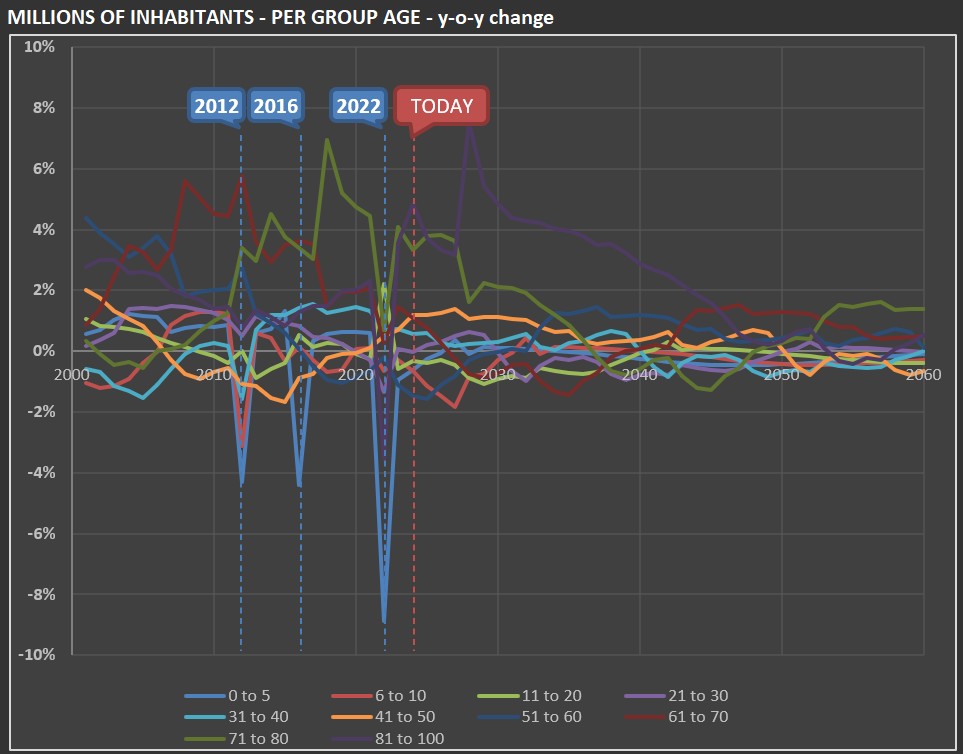
The yellow arrow highlights the “zero to 5” group. Just below it is the “6 to 10” group. Note that the US Census Bureau drops the number of young children in the US with each dataset revision. The second chart gives you an idea of how much: in 2022, the “zero to 5” group’s estimate was reduced by almost 9%!
Glass Half Full: OI's Strategic Pivot Promises Value Amid Historic Low P/E
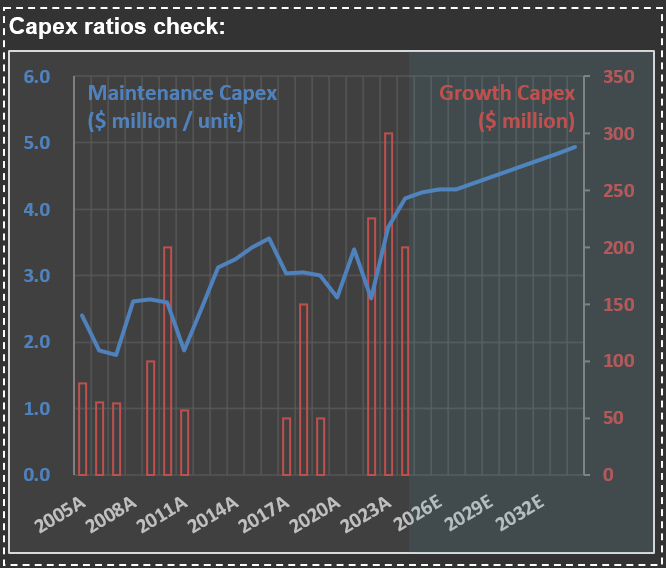
Never underestimate how much money CEOs can burn (and still be paid millions to do so!). Below is my check for Capex for $OI [OI-Glass], the biggest glass containers manufacturer in the world. The company battled massive asbestos liabilities for years. When that got solved, what was the prior CEO plan? Burn almost $1 billion (these are the sum of the two last groups of the red bars) in a new technology called MAGMA.
Here is what the new CEO just said about it: “With regard to MAGMA, we continue to ramp up production at our first greenfield line in Bowling Green, Kentucky. The achievement of key operating and financial milestones at this site over the course of 2025 will be critical as we chart the future of the MAGMA program. As we focus on these milestones at Bowling Green, we have paused the development of Generation 3. As with any capital project, MAGMA will be required to generate returns of at least WACC plus 2%. We will provide more details on our long-term strategic plan next month at our Investor Day.”
In other words, MAGMA didn’t work (as I’m assuming it doesn’t generate returns above WACC). So I will be in New York on March 14th - at the NYSE - to participate on the company’s Investor Day. I hope they will provide information that will increase investors confidence. As of now, if they achieve their $1.45 billion EBITDA guidance for 2027, it means that the company is trading at less than 3x P/E! I don’t use multiples to calculate fair values for companies at RIM. But such a low figure called my attention!
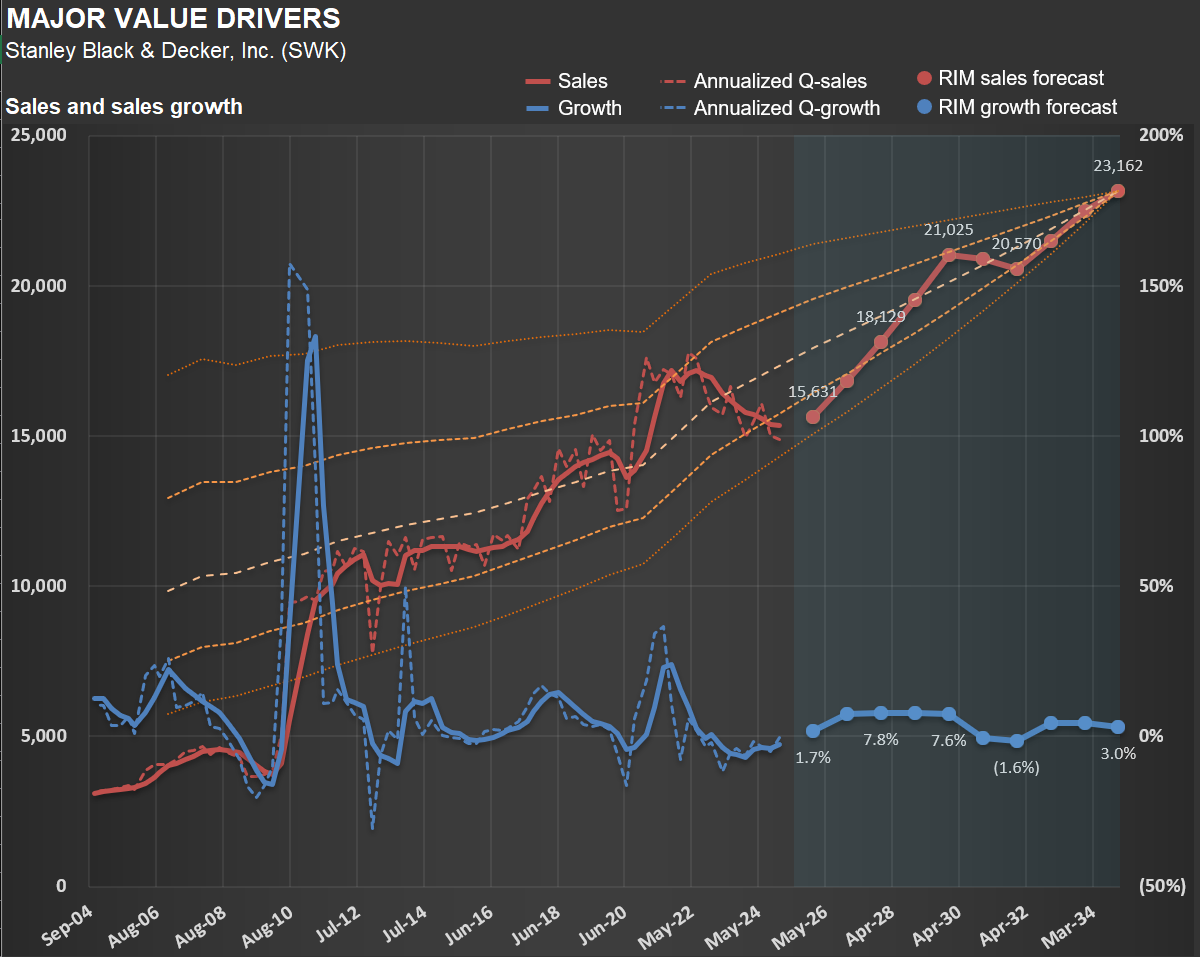
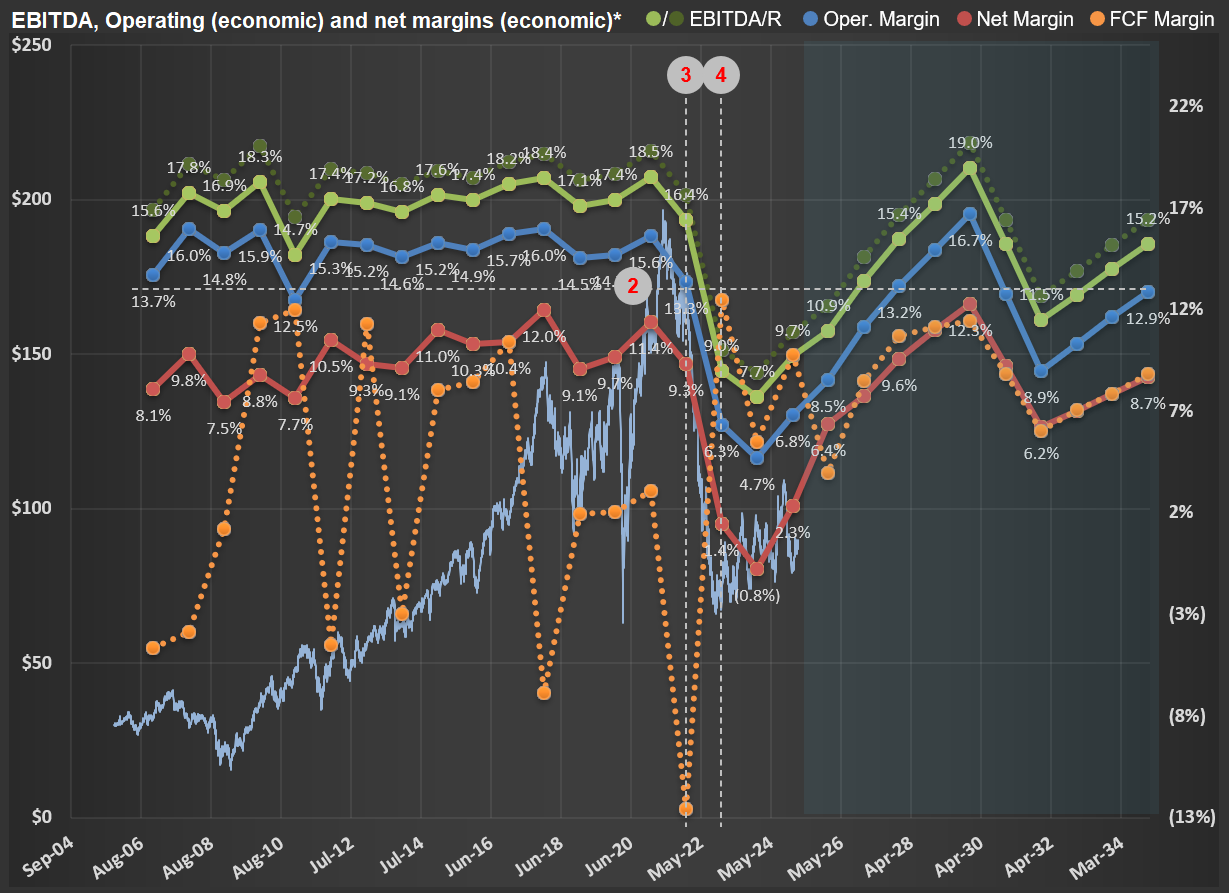
Stanley Black & Decker: Sales Slump and Margin Collapse in the Post-Stimulus Reality
The first picture below shows sales for $SWK (Stanley Black & Decker) - see how it is now below the mid-trendline (which includes the impact from inflation + population growth). The second picture shows margins - it is amazing how strongly impacted their margins were when it became clear that management misinterpreted the excessive stimulus of 2020/2021.
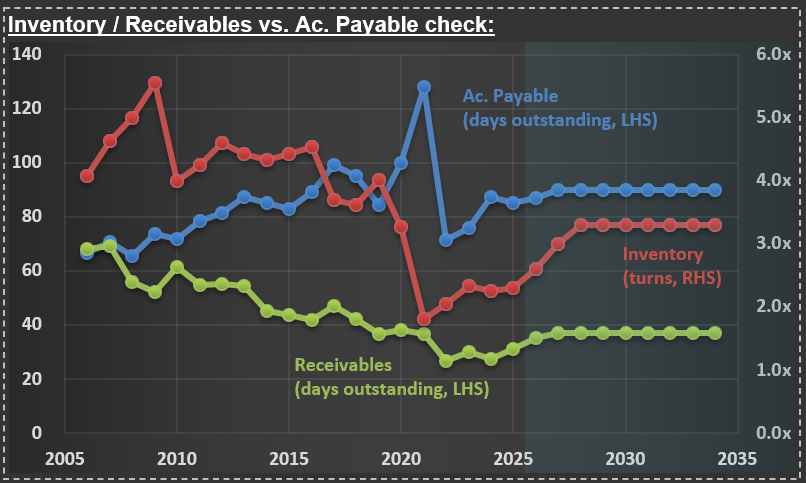
Stanley Black & Decker's Balance Sheet Battle: Unwinding Pandemic-Era Inventory Excesses
I’m working on $SWK [Stanley Black & Decker] today. It is incredible to see what the pandemic did to key lines of companies' balance sheets. The chart shows a massive drop in “inventory turns” (red line) in 2021, meaning that the company overproduced (and ordered excessively from manufacturing partners) tools and whatever it sold. They are bringing inventory to more normal levels, but it will be a multi-year exercise. Accounts Payable (blue line) are close to normal levels but look at the massive peak during the pandemic.
J.B. Hunt's Equipment Dilemma: Pandemic Expansion Meets Post-Boom Reality
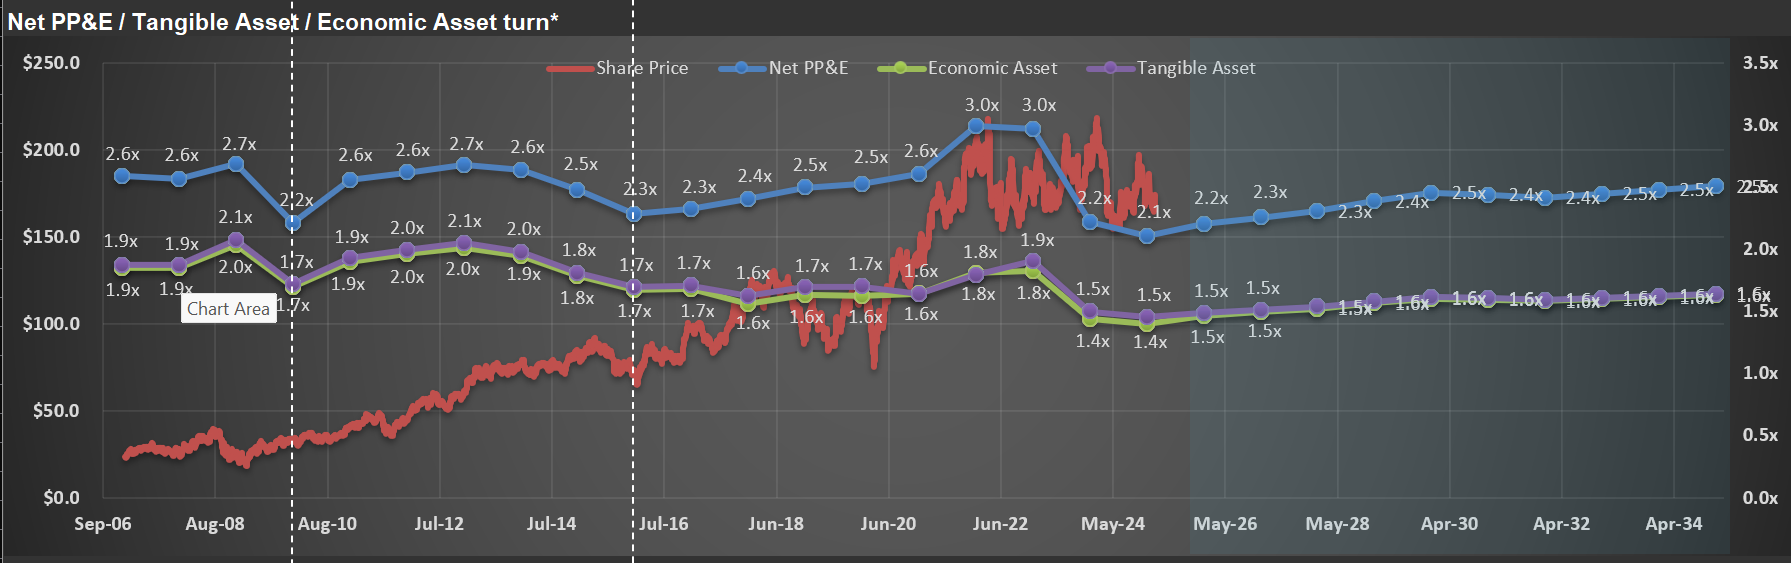
Look at what $JBHT management said during the last conference call: “…we still have really significant capacity that’s underutilized. And the cost to store that equipment is a significant headwind for us. And so as we continue to scale and grow our volumes, while also improving pricing, that’s going to be our focus and our effort. The Walmart equipment, we reported – I think we reported just over 122,000 containers at the end of 4Q. When we onboarded the Walmart equipment, all of that equipment requires a modification and we haven’t completed that work. Clearly, we just did the acquisition in, I think, the second quarter of – or end of first quarter, second quarter last year. And that equipment is tucked away in storage right now because frankly, we’re still trying to grow into the 122,000 containers that you can see we own today.”
This was a classic over-investment situation, given the strong cycle for trucking companies during the pandemic (mostly on pricing, as companies were willing to pay anything to secure transportation capacity). The result: a very low “Net PP&E turnover”—see the blue line on the chart. It is as low as in the deep recession years of 2009.
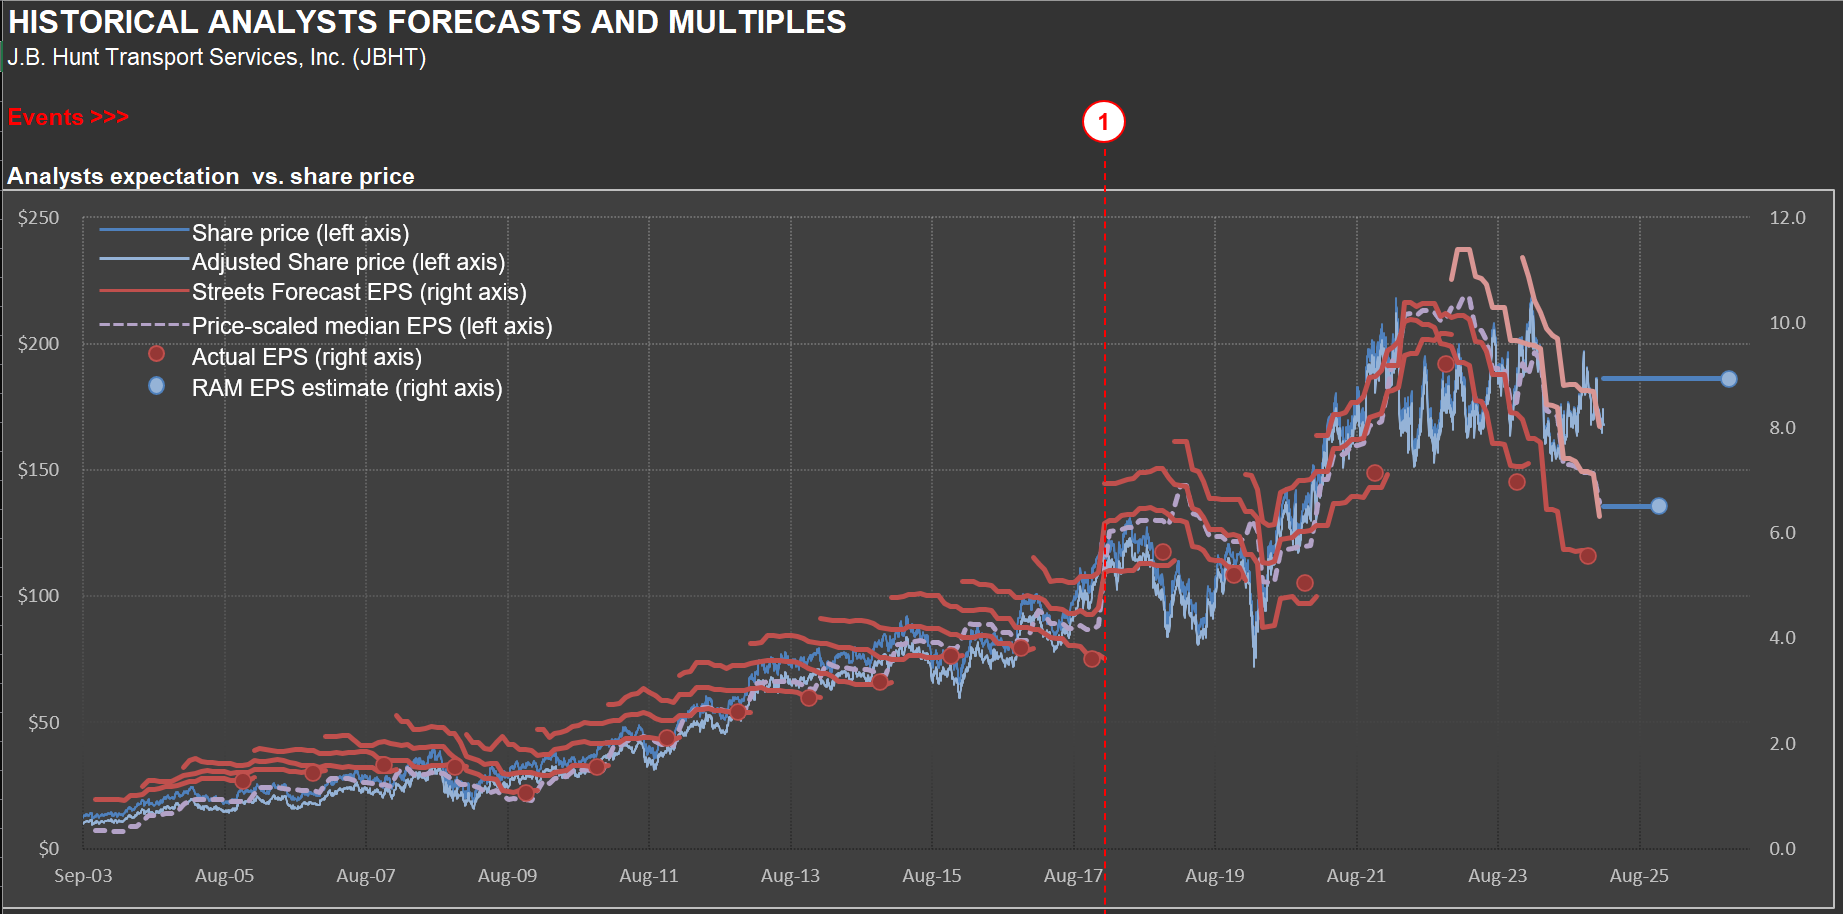
J.B. Hunt: Share Price Defies Earnings Gravity - Market Optimism or Pandemic Memory Bias?
For most companies, share prices follow short-term EPS (in other words, the Market doesn’t anticipate much—it just reflects what it sees “as of now”). It isn’t different for $JBHT — see how the share price follows expected EPS on the chart. However, the current market price appears to be fighting a substantial decline in earnings. Maybe it’s because trucking companies made a disproportional amount of money during the pandemic, biasing some investors regarding how much they are willing to pay for J.B. Hunt’s earnings.
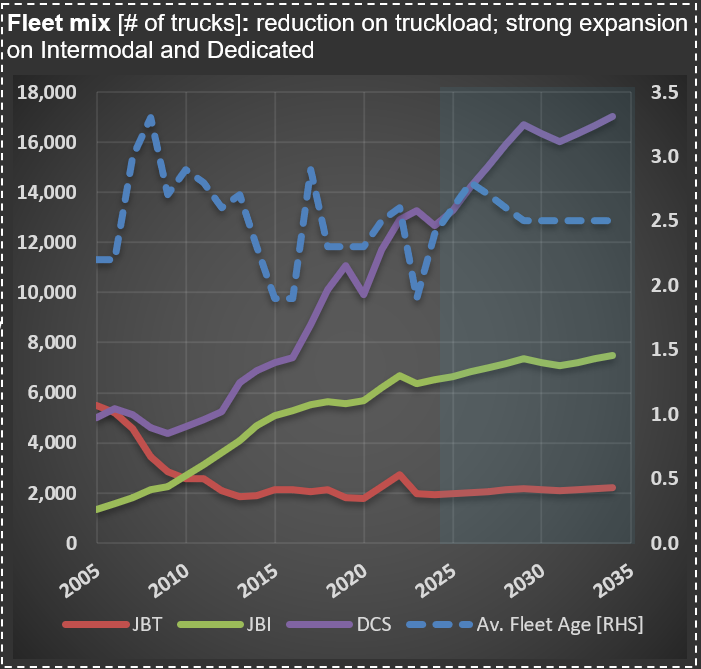
Fleet Age Dynamics: How J.B. Hunt's Minor Aging Shifts Drive Major Truck Purchase Swings
I’m working on $JBHT [J.B. Hunt] today. It is incredible how relatively small fluctuations in the average age of a trucking company’s fleet (represented by the dashed blue line on the chart) change the demand for new trucks. The company went from buying almost 6,000 trucks in 2021/2022 to something close to 3,600 trucks now.
Trucking Tonnage Trends: What ATA Data Reveals About Economic Momentum
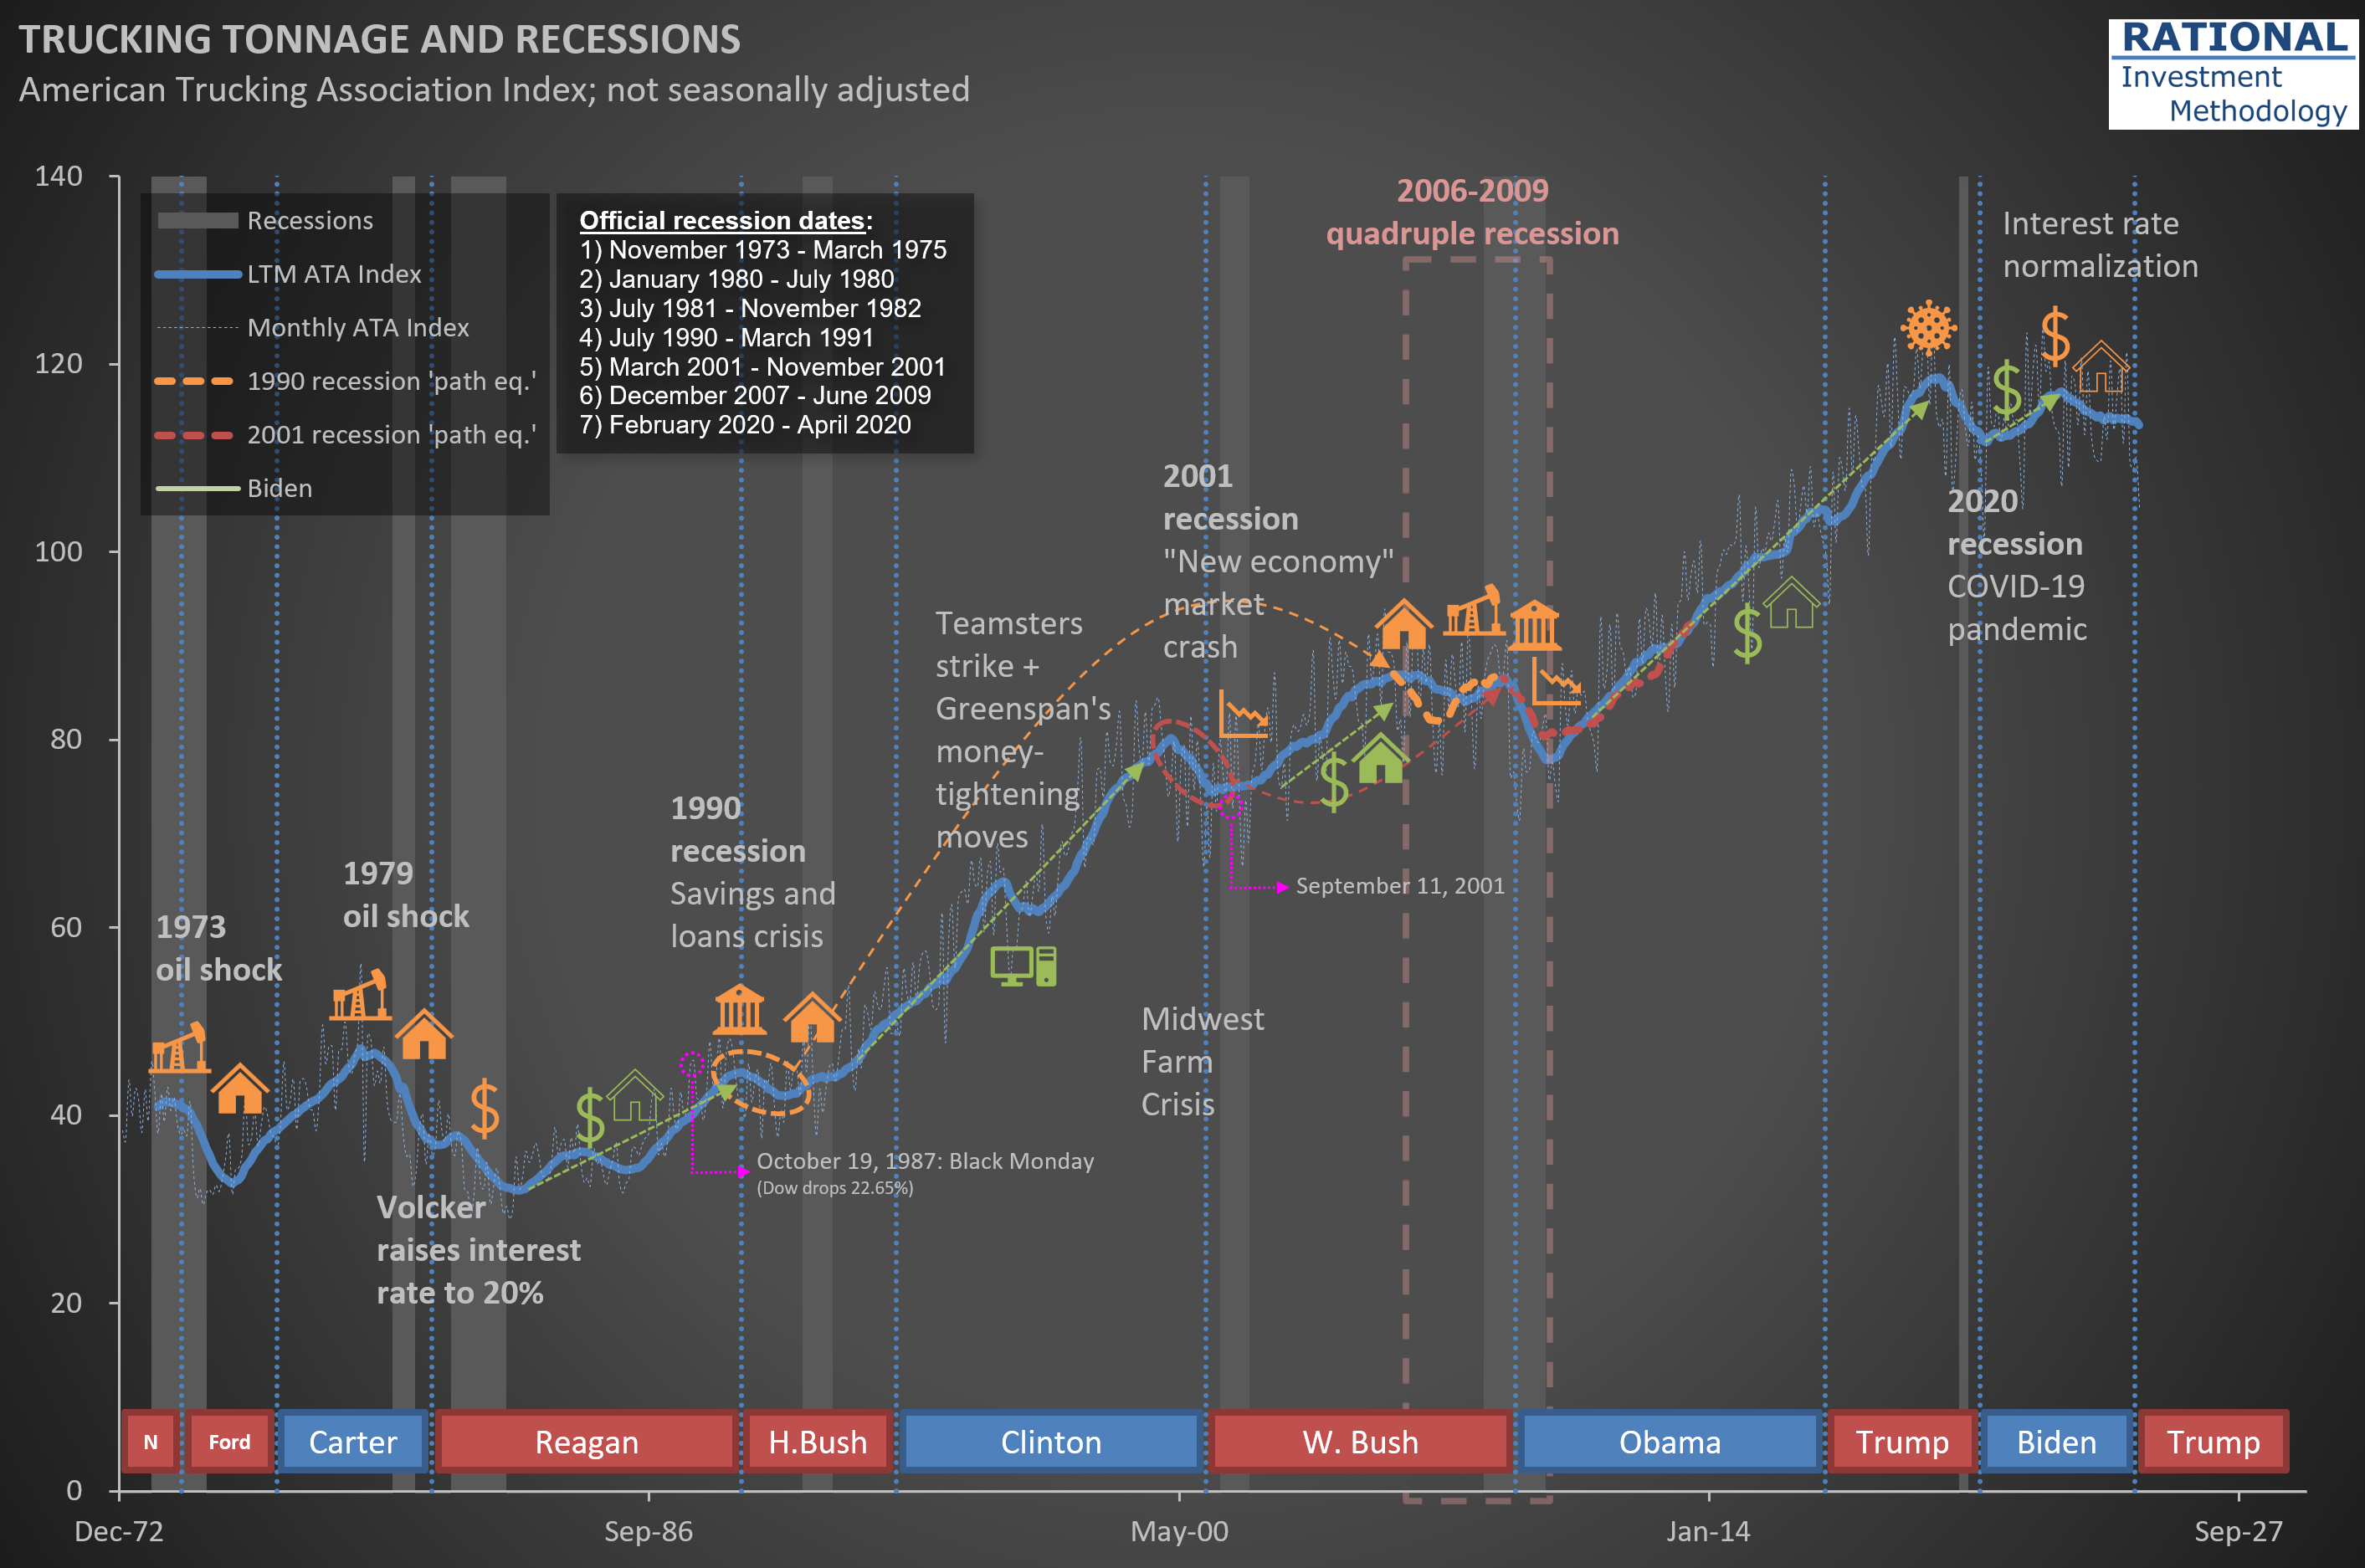
Trucking tonnage data from the American Trucking Association (ATA) reveals a persistent sluggishness in demand for trucking services. Take a look at the long-term perspective in the chart below, which helps contextualize current industry conditions within historical patterns.
The visualization offers valuable insights into freight movement trends—often considered a bellwether for broader economic activity. For those monitoring economic signals, this data point merits attention alongside other indicators when evaluating the current business cycle position.