CofC: Consumer Discretionary - Consumer Durables & Apparel
Consumer Weakness and Tariff Pressures: Inside $HELE’s Latest Results
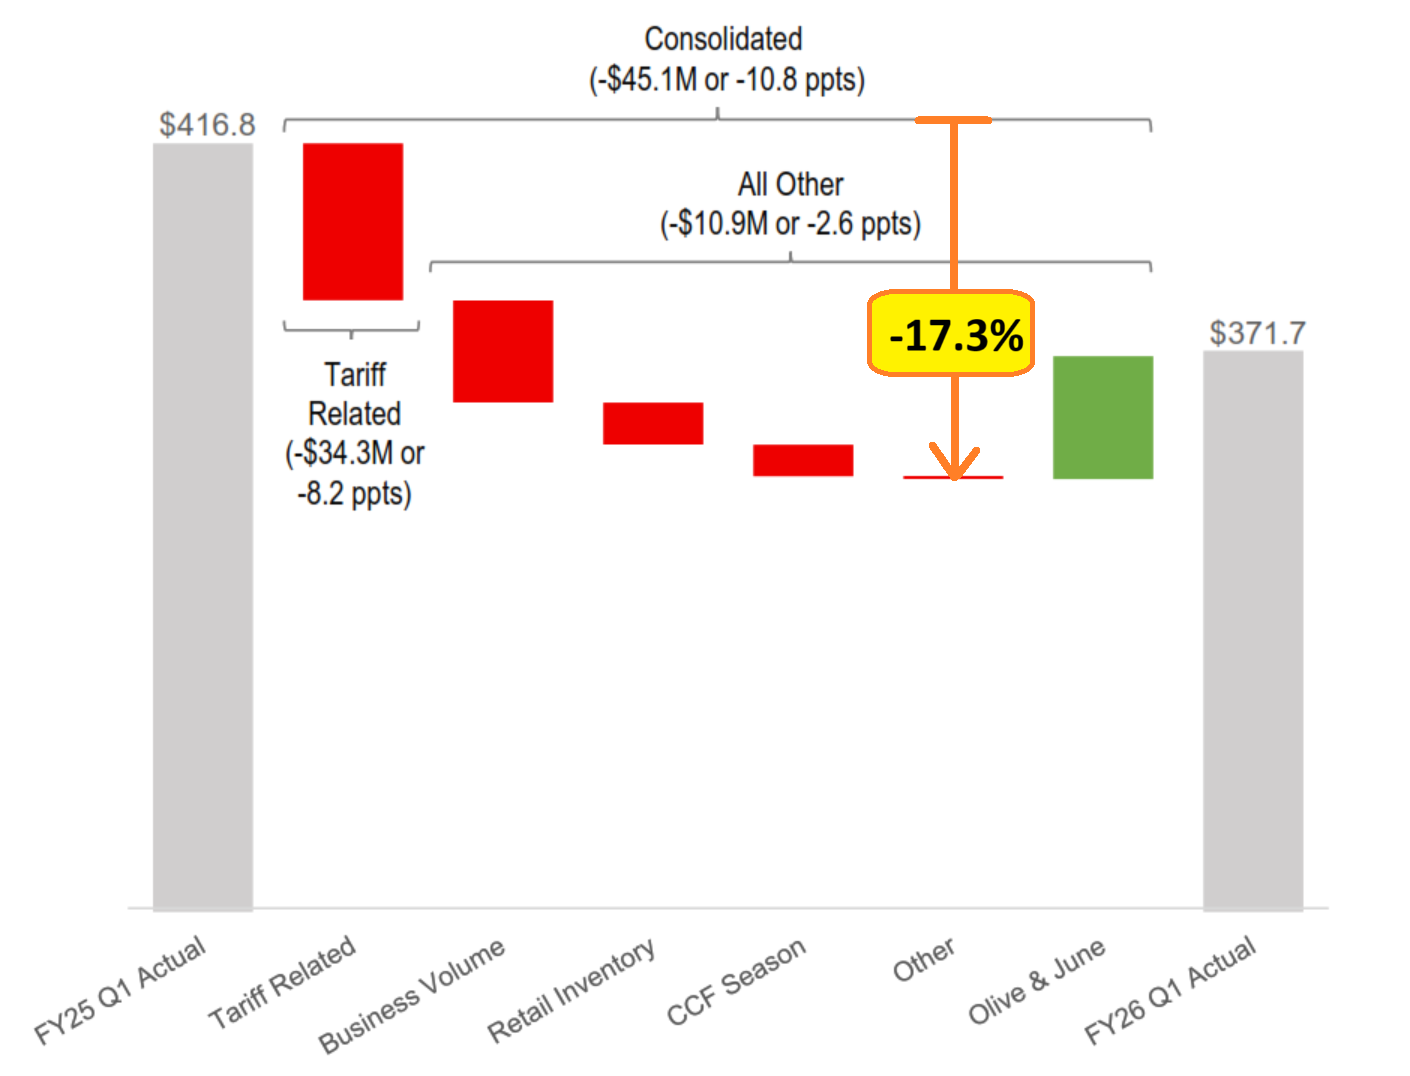
Yesterday brought the first quarterly earnings release from $HELE (Helen of Troy), and the impact of tariffs was unmistakable. The company reported its 1QFY26 results[*], and the numbers were sobering. Excluding the effect of its recent acquisition, sales declined 17.3% year-over-year (see picture below).
Helen of Troy markets a range of consumer goods through brands you likely recognize. In their Home & Outdoor segment, they own OXO, Osprey, and Hydro Flask. In Beauty & Wellness, they own or have the rights to brands such as Revlon, Honeywell, Vicks, Braun, Olive & June, and others. If you’re curious, you can browse their products here.
What stands out from the report is the company’s ability to pinpoint sales lost directly to tariffs. Some clients deliberately held off on orders, hoping to ride out the current tariff environment and replenish inventory later—ideally at a lower tariff rate, but without sacrificing sales in the meantime.
Not all of the sales decline could be tied to specific customer actions. The company also classified portions as “business volume” losses and “retail inventory” adjustments. Regardless of the breakdown, this marks the fourth consecutive year of declining sales at $HELE. The first two years could be chalked up to post-pandemic normalization. Still, the last two years reinforce a trend I’ve highlighted here before: American consumers are simply not consuming at pre-pandemic levels.
Even if, over time, imported products are replaced by domestic alternatives, the initial effect is predictably negative. For $HELE, it’s highly unlikely their contract manufacturers will relocate production to the US—labor costs are simply too high for US-based factories to compete with Asian manufacturers, even if tariffs reach triple digits.
It remains to be seen how the shifting US tariff landscape will ultimately shape the broader economy.
[*] Their fiscal quarters end in February, May, August, and November.

Is Sleep Number ($SNBR) Feeling the Weight of Consumer Recession?
When analyzing a company, understanding the industry it operates in is essential. Today, I’m focusing on $SNBR (Sleep Number Corporation), a company whose valuation history over the past 20 years has been remarkably volatile. This volatility stems from the cyclical nature of the mattress manufacturing and retailing industry, compounded by decisions made by two consecutive CEOs to leverage the company ahead of major industry downturns.
While the leverage applied in both cases wasn’t excessive, Sleep Number operates with a naturally leveraged business model due to its reliance on rented stores, which adds fixed costs to its P&L. During the Great Financial Crisis (GFC), the company nearly collapsed despite carrying only a modest debt load (but eventually managing to pay down all its debt). Fast forward to recent years: the outgoing CEO—who earned nearly $80 million during her tenure—chose to leverage the company again by authorizing $1.6 billion in share buybacks. The result? Sleep Number now faces significant financial strain with $550 million in debt.
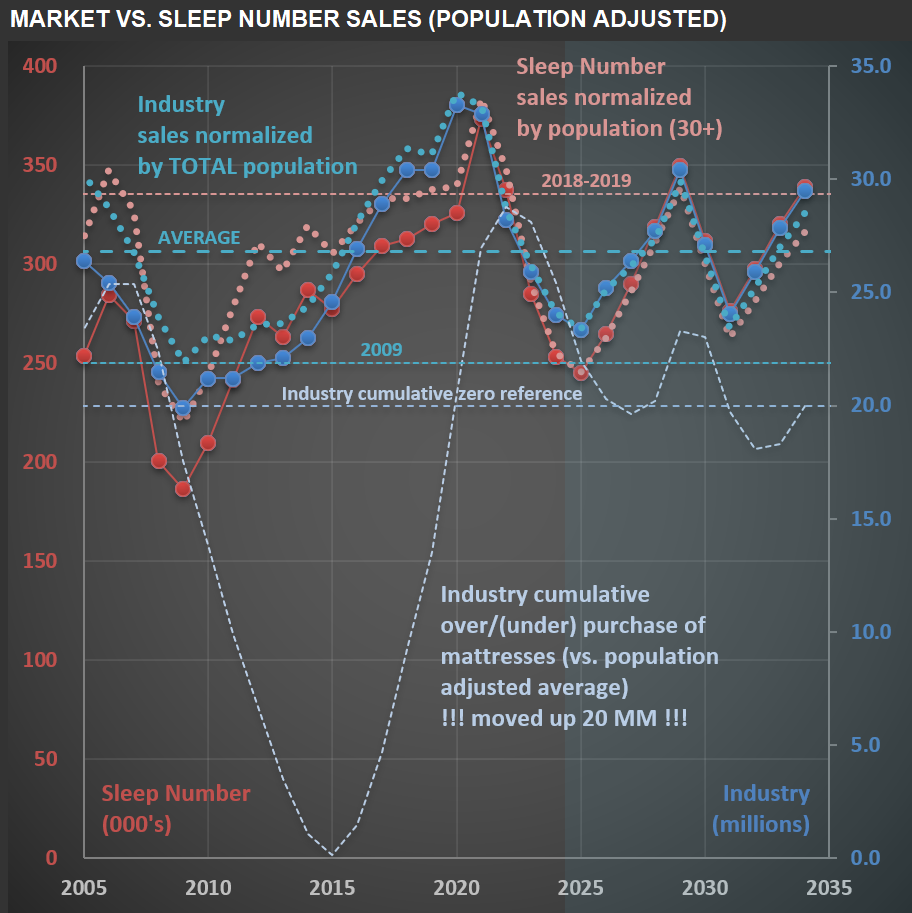
The chart below provides a visual overview of Sleep Number’s sales (in red) over the past 20 years and projects a base-case scenario for future sales. It also compares these figures to unit sales for the entire mattress industry (in blue). Unsurprisingly, the two are closely correlated—any shifts impacting the broader industry inevitably affect Sleep Number. The dotted light-blue/red lines adjust these figures for population dynamics. For the overall mattress industry, I use the total population. However, for Sleep Number, I focus on individuals aged 30+ years who are more likely to purchase their premium mattresses.
Several reference lines on the chart offer additional context. One highlights industry sales levels during 2009, which we’re approaching but haven’t quite reached yet. If mattress unit sales decline by another million in 2025, per capita mattress sales will align with GFC levels—a concerning benchmark. Another line (light blue) illustrates cumulative under- or over-purchasing trends within the industry. Even if recent declines reflect a correction from prior excesses, seeing per capita sales nearing 2009 levels is striking. This aligns with broader indications that American consumers are facing recessionary pressures—a topic I’ve explored in previous posts.

Carter's 2025 Forecast vs. Reality: A Humbling Lesson in Long-Term Guidance
Companies usually provide “guidance” for short term expectations. It helps when there are more complex changes in the P&L (for instance, after an acquisition and/or disposal). But sometimes, they provide longer-term guidance, as did $CRI (Carter’s) management in early 2021. The picture below shows their guidance for 2025 (on the left). On the right, what might happen (as we are now entering the “target year”). The delta between expectations vs. reality is significant (and I’m using a “normalized margin” for 2025 - the actual is expected to be closer to 7%). This example underscores how difficult it is to make forecasts. If it is that hard for a company’s management team that sells baby clothes, founded 160 years ago, can you imagine your chances to forecast sales and profitability in the technology field correctly? If you want to invest (instead of speculate), focus on mundane businesses. And even so you will be humbled by your mistakes!

US Census Bureau Revisions Shrink America's Youngest Population: Implications for Carter's Future Market
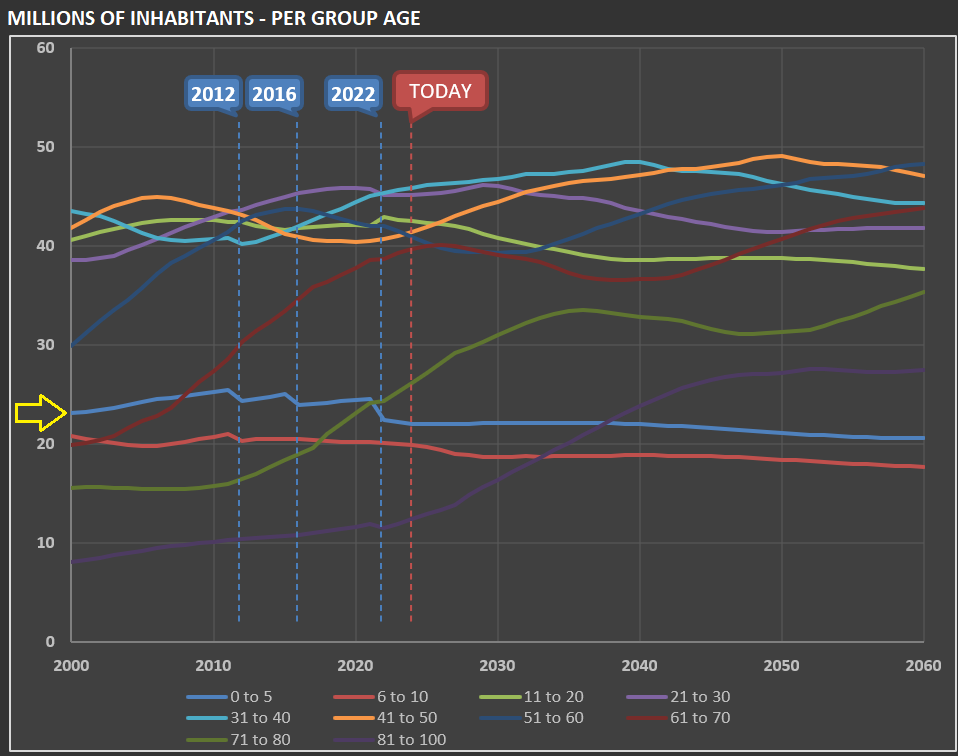
When I’m working on $CRI [Carter’s], I need to update the forecasted population growth for the “zero to 5” segment in the US (done by the US Census Bureau), as they are the company’s core “clients.” The first chart below shows—per various group ages—how many millions of people the US has had and is expected to have over the next few decades.
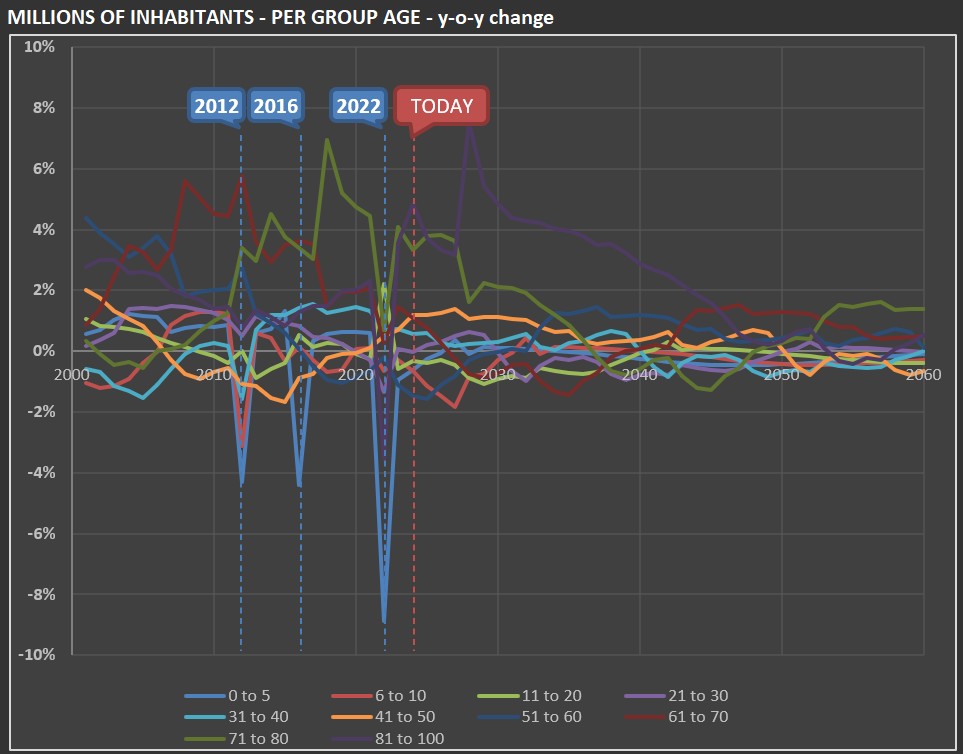
The yellow arrow highlights the “zero to 5” group. Just below it is the “6 to 10” group. Note that the US Census Bureau drops the number of young children in the US with each dataset revision. The second chart gives you an idea of how much: in 2022, the “zero to 5” group’s estimate was reduced by almost 9%!

