$OI [O-I Glass]: Cassandra in Perrysburg, or a Room Where No One Says No?
O-I Glass reported its second quarter on July 28th, and the Market’s answer arrived the next morning: the shares fell roughly 17%, from about $9 to near $7. O-I’s European segment earned a 0.9% operating margin in the quarter — $6 million of profit on $704 million of sales, against $90 million a year earlier. Year to date, Europe is at 0.4%. The Americas, meanwhile, put up 17.4%, which management described as the best second quarter that segment has produced in a decade.
So the company is running two businesses that no longer resemble each other. And management’s response to that divergence is a promise.
The Promise
On the call, the CEO said Europe should be back to mid-teens segment margins within two years, and later in the same session upgraded that to “high-teens” over the next 18 to 24 months. The path, as described, runs through recovering excess cost inflation, working off the temporary disruption from three plant closures and two furnace events, energy markets normalizing, and finishing the Fit to Win implementation — Europe being, in his words, roughly a year behind the Americas.
Much of the first-half damage genuinely does look transitional. A fire in France and a leak in the UK, on top of closing three factories in the space of two quarters, is a real operational shock, and the CFO was straightforward about it: about 80% of the roughly $25 million miss versus their own internal expectation for Europe traced to operating disruption rather than anything commercial. European volumes were down 2%, and flat excluding the disruption. That is not a demand collapse.
But “the disruption was temporary” and “margins go to high teens” are two very different claims, and only the first one is supported by what happened in the quarter.
What Europe Has Actually Delivered
This is where I go to the chart rather than the transcript.
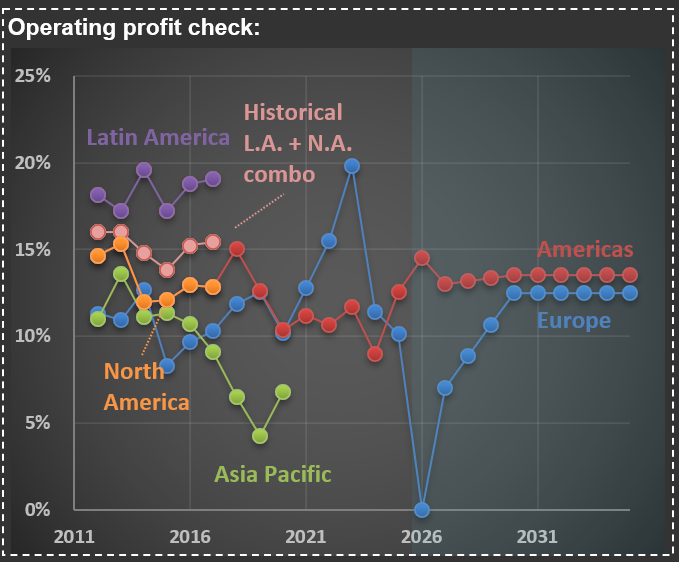
The chart tracks operating margins for every segment O-I has reported over the past fifteen years, through two changes in reporting structure. On the left you see the old geography: Latin America running in the high teens to 20%, North America in the 10%–16% range, and Asia Pacific decaying from 13% to the mid-single digits before it was sold. The lighter line marked “Historical L.A. + N.A. combo” bridges those into what is now reported as the Americas. Europe is the blue line.
Two things stand out. The first is that Europe has spent most of its recorded life somewhere between 10% and 13%. The second is the one exception — the spike toward 20% around 2022–23. That was not a step-change in competitiveness. That was hedged, favorably priced energy, at precisely the moment European gas prices were dislocating. O-I’s own guidance page tells you what happened to it: a roughly $150 million headwind in 2026 from the “energy reset” as those favorable EU contracts expired in December 2025, plus another $50–100 million of incremental energy inflation tied to the Middle East conflict.
Put plainly: the only period in which O-I’s European business earned high-teens margins was a period in which it was buying energy at prices no longer available to it. Management is now guiding to that level as the destination, in a world where the input that produced it has gone the other way.
The Arithmetic of the Promise
Suppose I take management entirely at their word. Not partially — entirely. Europe reaches 17%. The Americas simply hold roughly where they sit today, call it 15%, which requires no heroics at all.
On something close to today’s revenue base — roughly $3.7 billion in the Americas and $2.8 billion in Europe — that produces about $555 million and $475 million of segment operating profit respectively, a bit over $1.0 billion in total. Take out the $110 million or so of retained corporate cost and add back $490 million of depreciation and amortization, and you land near $1.4 billion of EBITDA. Which, incidentally, is roughly the $1.45 billion target from the 2025 Investor Day that the CFO said on this call the company still believes is achievable, just later than planned. The promise is internally consistent, at least.
Now walk it down to the owner. Cash interest runs about $340 million. Cash taxes, on that level of earnings, perhaps $150 million. Call it another $60 million for pension, the restructuring tail, and working capital. That leaves roughly $860 million of operating cash flow. Against 153.5 million shares, that is about $5.50 per share.
Capital spending is guided to $425 million this year, which includes catch-up furnace rebuilds; a normalized number closer to $385 million is about $2.50 per share. Which leaves roughly $3.00 per share of free cash flow to the owners of the business, every year.
The shares closed near $7. The company holds $339 million of cash — about $2.20 per share — against no maturities until 2028 and $1.5 billion of liquidity. Strip that out and the Market is currently valuing O-I’s entire operating business, 61 plants across 18 countries, at roughly $5 per share.
Three dollars of annual free cash flow against five dollars of enterprise value. Read that again, slowly, because it is the whole post: if management is right, the company generates enough cash to buy itself outright — at today’s price — in under two years.
I have made this argument before, in a different industry, about Charter (here). A free-cash-flow yield of that magnitude is not the price of a mature business with a soft patch in one region. It is the price of a business the Market has decided will not exist in its current form.
So Which Is It?
There are only two ways to reconcile a management team stating something like this out loud with a share price that treats it as noise.
The first is that they are Cassandra. The daughter of Priam, King of Troy, was given the gift of prophecy by Apollo; when she refused him, he could not revoke the gift, so he added a curse — she would always speak the truth, and no one would ever believe her. She saw the fall of Troy. She warned about the horse. She was ignored, and she was right. If Gordon Hardie (OI’s CEO) is Cassandra, then everything he said on that call is accurate, the market simply refuses to hear it, and $7 is one of the more remarkable prices on offer in the US equity market today.
The second possibility is less flattering and considerably more common. Executive suites are structurally poor at receiving bad news. The people who report to the CEO are the same people whose plans, budgets, and bonuses depend on the target being reached. Nobody walks into that room to say the high-teens number is not happening. In that version, management are not prophets; they are petits dictators, sincerely repeating a figure that no one around them is incentivized to contradict — right up until the quarter when reality contradicts it for them.
Readers of this blog have seen me raise the same question about Vulcan’s $20-per-ton promise (here), and about Walmart, where a CFO floated 6% domestic margins back in 2017 and the company has essentially never delivered them since (here). The pattern is not malice. It is that forecasting is hard, incentives are asymmetric, and a target announced from a stage acquires a life of its own.
What I Actually Assume
Which brings me to why this distinction, however entertaining, does not drive a single decision at RIM.
I do not forecast what a CEO says a company will deliver. I forecast what the company has delivered, across cycles, across management teams, across two decades of reporting changes — and then I ask what price makes that history worth owning. That is the discipline, and it is the reason my Whole Foods model from 2017 held up eight years later (here): I was not prescient, I was careful about what I assumed.
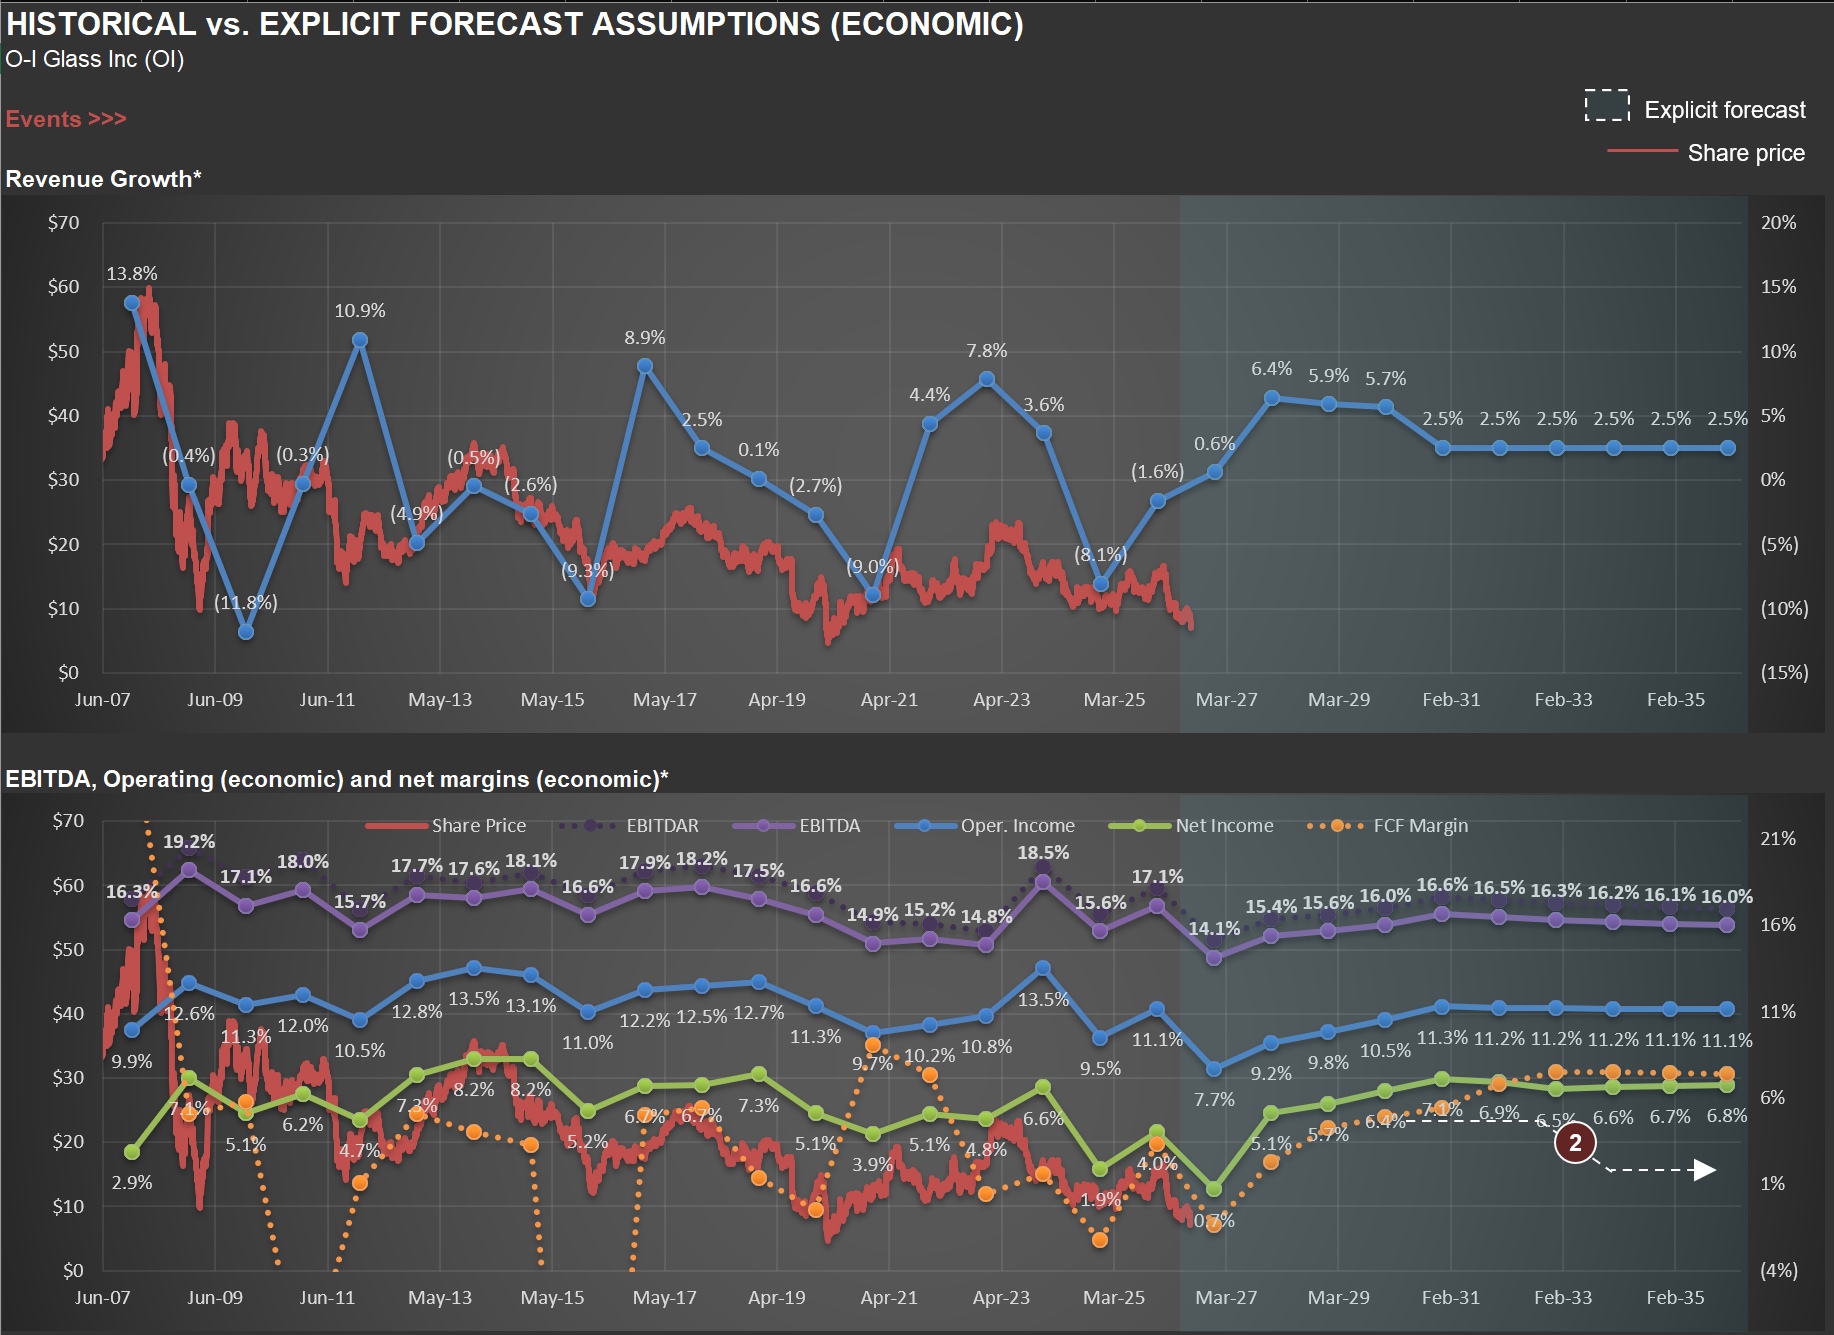
The chart below is the explicit forecast that comes out of that process for $OI. Look at what is in it, and more importantly at what is not.
Revenue growth settles at 2.5% — population plus inflation, roughly, for a mature packaging business. EBITDA margin drifts to about 16%, below the 17%–18% the company routinely produced through the 2010s. Operating margin near 11%, net margin under 7%, free-cash-flow margin in the 6%–7% range. Go back to my first chart and you will find the same conservatism: Europe recovering to about 12.5% and the Americas settling near 13.5% — in both cases below where each segment sits or has recently sat.
Now hold that against the promise. Europe at 17% and the Americas at 15% implies a consolidated EBITDA margin above 20% — a level O-I Glass has not reached in the entire span of the chart, including the pre-crisis peak. My forecast assumes the company never gets there.
And here is the part that matters. At roughly $7 per share, on those deliberately unambitious assumptions, $OI screens as severely undervalued anyway. The implied IRR (now at almost 29%) does not require Europe to reach high teens. It does not require the Fit to Win program to hit a single one of its remaining milestones on schedule. It does not require the war to end, or European gas to normalize, or the furnaces to behave. It requires only that O-I Glass go on being the somewhat mediocre, cyclical, capital-hungry glass manufacturer it has been for the last fifteen years. (For how a given IRR translates into compounded returns, see here.)
That is the comfortable place to stand. If management turns out to be Cassandra, the return is spectacular and I will have paid nothing for the possibility. If they turn out to be the other thing, I own a business at a price that already assumes they are.
I leave it to you to work out which of the two I think they are.