CofC: Materials - Materials
$VMC [Vulcan Materials]: A $20/Ton Promise—and a Few Reasons for Skepticism
Last week, Vulcan Materials hosted its 2026 Investor Day. The headline number? Management told investors they see a path to $20 per ton of aggregates cash gross profit—roughly double where they are today. Standing on the floor of the NYSE, the CEO put it this way: “just two and a half years ago, our average selling price was less than $20.” Now they expect to make that much in profit per ton.
That deserves a closer look.
The Long, Slow March from $7 to $11
Before getting excited about the next double, it’s worth remembering the journey to where they are. The picture below summarizes it nicely.
It took Vulcan roughly seven years to go from $7 of cash gross profit per ton (in the pre-housing-crisis days) to $8. That period included the housing collapse, a multi-year recovery, and a meaningful tailwind from low diesel prices. Diesel matters here—it’s directly about 10% of operating costs and indirectly much more (trucking, asphalt, plant power). The black/gray line on the chart is diesel inverted: when diesel is cheap, aggregates margins benefit, and you can see the two lines move together for long stretches.
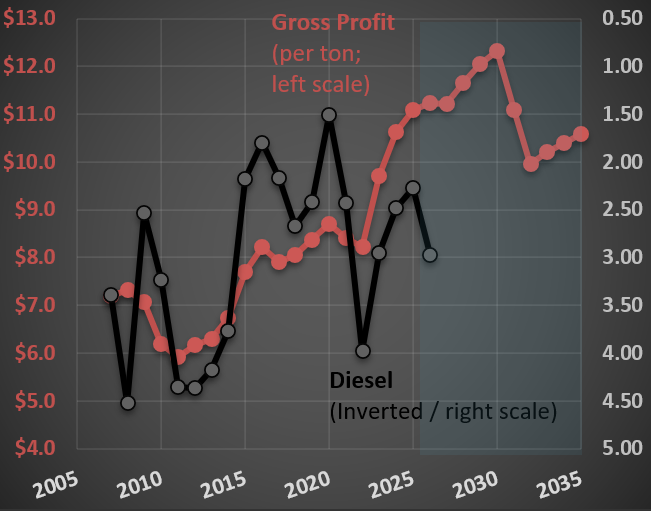
Then came the pandemic. Inflation everywhere—fuel, parts, labor. Aggregates producers responded by raising prices aggressively, and Vulcan rode that wave from $8 to $11 in just a few years. To management’s credit, they handled the inflation passthrough well. But it’s worth being honest about what drove the jump: it wasn’t structural genius—it was a once-in-a-generation inflationary environment that gave the entire industry cover to push prices simultaneously.
Now Comes the $20 Target
So what’s the path to $20? Management says high-single to low-double-digit annual growth in cash gross profit per ton, against demand growing at “low single digits.” They’ve promised more real price improvement than historical averages and lower real cost increases than historical averages. Both at the same time. The implied adjusted EBITDA roughly doubles to $4.5–5.0 billion (from $2.3 billion in 2025).
Two things make me skeptical:
First, every aggregates producer—and a few new entrants—is busy expanding capacity. Read any of Vulcan’s competitors' transcripts and you’ll find the same enthusiasm and the same playbook. When everybody and their mother is pouring capital into the same business, the historical pricing discipline that supports those margins gets harder to defend, not easier. Vulcan itself has acquired 36 aggregate operations and completed 7 greenfields in the past 3.5 years. They’re not the only ones.
Second, the demand story leans heavily on two narratives that have become load-bearing in nearly every industrial company presentation: AI and data centers. These terms came up at the Investor Day 28 times! The CEO described energy projects “to feed data centers and support the age of artificial intelligence” as a coming tailwind to aggregates intensity.
I’ve written before about why I think this is mostly a story, not a number. In this post, I showed that data center construction—even at its current historical peak—accounts for slightly above 2% of total US construction spending. The money in data centers is in the chips and servers inside the buildings, not in the aggregates underneath them. That doesn’t make data centers irrelevant to the broader economy; it means they’re nowhere near large enough, on the construction side, to move the needle for a company like Vulcan Materials.
The Familiar Pattern
This isn’t unique to Vulcan. I noted something similar with $FLS recently (here), where mentioning “nuclear” 25 times in an earnings deck added 30% to the share price for a company with roughly 3.5% nuclear exposure. The mechanic is the same: associate the business with a hot narrative and let multiples do the work.
To be fair, Vulcan is a quality company with irreplaceable assets, real pricing power in concentrated markets (while the FTC is sleeping at the wheel), and a management team that has executed well over a long stretch. Going from $11 to $20 requires some combination of (i) sustained broad-based inflation that the whole industry gets to ride, (ii) genuinely structural improvements in unit economics that haven’t quite shown up in 70 years of company history, and (iii) a demand environment meaningfully better than what management itself describes as “low single digits.”
The history of capital-intensive cyclical businesses hitting targets that depend on simultaneously beating both real price and real cost expectations is not encouraging.
Forecasting $EXP Sales: How Home Starts and Industry Behavior Intersect
Sometimes clients wonder why I devote so much time to producing (and updating) a wide array of industry-wide analyses. For example, you’ve likely seen the posts I’ve published covering the housing (here) or transportation (here) sectors. The reason is simple: industry dynamics are typically the critical force shaping sales for any individual company.
Take today’s focus: $EXP (Eagle Materials), a leading U.S. producer of wallboard and cement, with additional operations in concrete and aggregates. See the first scatter plot.  It highlights the strong correlation between U.S. wallboard sales and new home starts (that is, newly constructed houses). While not all wallboard goes into new housing, this single variable explains nearly 90% of total sales, reflecting the interconnectedness of adjacent areas within the housing complex.
This is why understanding the cycles of new home starts in the U.S. is essential for accurately forecasting sales for Eagle Materials’ wallboard segment. From there, it’s a straightforward process to estimate $EXP’s market share and, with further analysis, explore the dynamics between capacity utilization and wallboard pricing—take a look at the second chart for a visual depiction. 
During the mid-2000s housing boom, capacity utilization at $EXP and its competitors reached very high levels (as did the price of wallboard). As the cycle turned and housing starts collapsed, utilization rates dropped—and prices followed. Then, something unusual happened: in the early 2010s, wallboard prices climbed sharply, even though the industry’s fundamentals seemed weak. For a while, my analysis questioned its relevance—until, almost a decade later, Eagle Materials (along with USG, the market leader) was fined tens of millions of dollars in a class action for price-fixing. In short, the major players had been colluding.
Looking ahead, pricing should remain relatively disciplined, especially with fewer homes expected to be built in the coming years (see my recent analysis on U.S. Census Bureau data and future new home starts - here). That said, if significant industry players resume collusive behavior, all bets are off—so I’ll be keeping a close eye on price developments in this segment.
Navigating Cycles: Insights from $OLN’s Volatile Industry
Today, I’m analyzing $OLN (Olin), a company specializing in chlorine, caustic soda, vinyls, and other chlorinated organics, as well as epoxy materials and their precursors. The charts below illustrate the challenges of operating in a cyclical industry—and what that means for investors.
On the left, you’ll see a price index for alkalies and chlorine (in blue), $OLN’s core product category, alongside a broad consumer price index (in red). On the right, the year-over-year changes for both series are displayed. The stark variability in commodity prices compared to broader price indexes is evident. The most recent spike was driven by two factors: heightened consumption during the pandemic—fueled by oversized government stimulus—and a fire at a major U.S. plant producing similar chemicals.
This volatility highlights how challenging it is to manage a business in such an environment. For investors, however, there’s an upside. These sharp price and volume swings can significantly impact $OLN’s profitability, leading to fluctuations in EPS and stock prices. For those willing to put in the work, these cycles create opportunities to buy or sell with a meaningful “margin of safety.” Of course, understanding these dynamics requires careful analysis and a great deal of patience.

$SEE’s Product Care Segment: A Warning Sign and The Market's Overreaction
$SEE (Sealed Air) is a name you’re likely familiar with, even if you don’t realize it. They’re the company behind Bubble Wrap—the iconic packaging material that’s as fun to pop as it is practical. Beyond Bubble Wrap, SEE provides materials and machines that streamline packaging processes across industries. If you’ve purchased food or products recently, chances are they were packaged using SEE’s solutions. You can find more examples of their offerings on their website.
Take a look at the chart below, which breaks down key metrics for SEE’s two segments: Product Care [PC] and Food Care [FC]. The dotted lines represent the impact of volume, price, and foreign exchange (FX) on sales. Meanwhile, the solid lines show cumulative volume indices for both segments (2006 = 100).
The blue line for Food Care reflects stability—no major surprises there. But the dark red line for Product Care tells a different story. After recovering from the lows of 2009, there was a modest uptick in 2021 (highlighted by the green circle), driven by pandemic-era stimulus. However, the red circle draws attention to concerning figures for 2024 and projected 2025. The index for Product Care volume is around 75—25% below its 2006 level (two decades ago) and even lower than the 81 seen in 2009.
This decline raises important questions. Packaging products and equipment is undoubtedly a competitive space, but SEE remains a key player in the industry. The drop in Product Care volume seems less likely to stem from a sudden loss of market share and more likely to signal broader economic trends—perhaps another indicator of a consumer recession. Despite this, the market appears to have punished SEE’s valuation, focusing narrowly on its current depressed earnings per share (EPS). Could this reaction be overly pessimistic?

Where Did the Cash from Operations Go?
Today, I’m diving into my analysis of $PKG (Packaging Corporation of America), a company that offers an interesting case study in how businesses deploy their cash beyond dividends and share buybacks. One common strategy is acquiring other businesses, typically within the same industry. This approach aligns with the broader trend in the U.S., a country I often refer to as “the land of oligopolies,” where many industries are dominated by a handful of major players. However, not all acquisitions are created equal—some management teams venture outside their area of expertise, attempting to diversify into uncorrelated industries. These moves frequently result in losses.
In contrast, PKG’s management opted for a more logical and focused strategy. In late 2013, they acquired Boise Inc., another paper and packaging company, for $1.3 billion. Since then, PKG has made additional acquisitions within its core industry, albeit at smaller scales.
The two charts below illustrate the impact of the Boise acquisition on PKG’s financials. The first chart highlights a notable surge in sales growth over the two years following the deal’s closure. This increase reflects the integration of Boise’s sales into PKG’s financials. The second chart shows a significant negative Free Cash Flow (FCF) margin during this period. FCF margin is calculated as (i) Net Cash from Operating Activities minus (ii) Net Cash from Investing Activities, divided by (iii) Sales.
The $1.3 billion spent on Boise is captured under “Net Cash from Investing Activities” pushing the total figure into negative territory. The key question is whether this acquisition will ultimately pay off—a question that demands detailed valuation work. After assessing the rationale behind a deal, it’s essential to adjust future projections to account for the new assets and business operations.
Getting this process right increases your chances of buying or selling a company at prices aligned with your investment thesis—whether long or short. Missing critical details or skipping a robust forecast can lead to mediocre performance at best. And if you happen to make money despite a flawed forecast? Recognize it for what it is: luck.
At its core, the job of an investment manager is to minimize reliance on luck by rigorously analyzing and projecting logical outcomes. Yet even when your analysis is spot on, patience and discipline are vital—it can take years for your thesis to play out fully.

Fundamental Analysis Spotlight: $OI and Market Mispricing
I attended the $OI (OI-Glass) investor day event and wanted to share some interesting insights. Look at the first chart below, which I pulled from their extensive 91-page presentation. Notice the projections for 2029: management targets EBITDA margins in the “mid 20s,” so let’s call it “around 25%.”
Now, check out the second image—this one shows my base-case scenario for OI-Glass. By 2029, my estimated EBITDA margin stands at 16.8%. I’m slightly more conservative in calculating EBITDA than management, as I leave some expenses on my calculations that they might exclude. So let’s round up my estimate to 17%.
But here’s the impressive part: OI-Glass appears substantially undervalued even using my conservative margin of 17% (or 8 percentage points below management’s target). Historically, the market has valued companies similar to OI-Glass—assuming my base-case scenario—at around 4 to 5 times today’s valuation. It would be much more with EBITDA margins of 25%!
This is a perfect illustration of market inefficiencies. The market isn’t fully pricing future profitability improvements implied by OI-Glass management’s expectations. Instead, share prices often reflect current EPS disproportionately. This is precisely where fundamental analysis adds value. If you’re skilled at (and have the time to dedicate to) understanding businesses and accurately forecasting long-term earnings potential, you’ll be well-positioned to identify opportunities (long or short) that eventually get recognized by the Market’s mechanical pricing heuristics.
Hence, I focus on first understanding what companies do and in which context (e.g., their competitive environment). Only after that do I spend time modeling a company in excruciating detail (also a necessary step to quantify your understanding of the business). With such an approach, I hope to be an “investor” and not a “speculator " (who blindly hopes that share prices move in their favor).


Glass Half Full: OI's Strategic Pivot Promises Value Amid Historic Low P/E
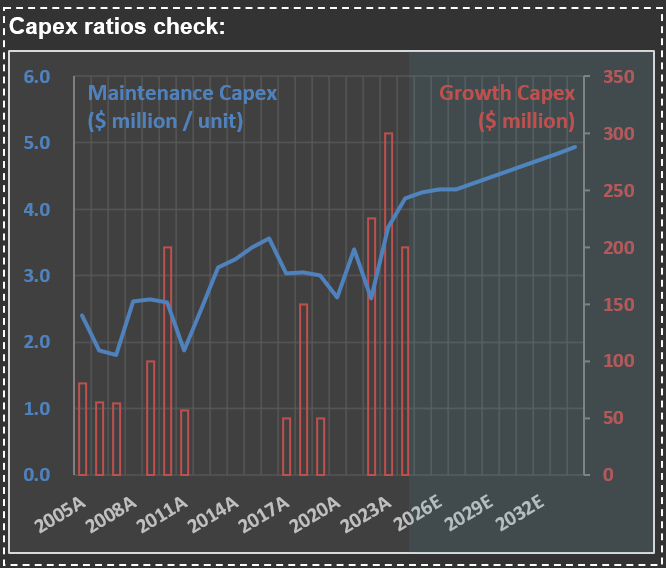
Never underestimate how much money CEOs can burn (and still be paid millions to do so!). Below is my check for Capex for $OI [OI-Glass], the biggest glass containers manufacturer in the world. The company battled massive asbestos liabilities for years. When that got solved, what was the prior CEO plan? Burn almost $1 billion (these are the sum of the two last groups of the red bars) in a new technology called MAGMA.
Here is what the new CEO just said about it: “With regard to MAGMA, we continue to ramp up production at our first greenfield line in Bowling Green, Kentucky. The achievement of key operating and financial milestones at this site over the course of 2025 will be critical as we chart the future of the MAGMA program. As we focus on these milestones at Bowling Green, we have paused the development of Generation 3. As with any capital project, MAGMA will be required to generate returns of at least WACC plus 2%. We will provide more details on our long-term strategic plan next month at our Investor Day.”
In other words, MAGMA didn’t work (as I’m assuming it doesn’t generate returns above WACC). So I will be in New York on March 14th - at the NYSE - to participate on the company’s Investor Day. I hope they will provide information that will increase investors confidence. As of now, if they achieve their $1.45 billion EBITDA guidance for 2027, it means that the company is trading at less than 3x P/E! I don’t use multiples to calculate fair values for companies at RIM. But such a low figure called my attention!