CofC: Industrials - Transportation
Did $EXPD Miss the Storm? Lessons from Their Q&A
As I updated my work on $EXPD (Expeditors; I discussed the company’s business in a prior post—here), I searched for their latest Q&A documents. Expeditors doesn’t host analyst conference calls, but you can send them questions that management periodically responds to. The most intriguing responses came from their January 13, 2025, Q&A.
What stood out was how a group of logistics specialists didn’t anticipate the tariff storm that was about to hit the industry. Here’s the exchange:
Question: Regarding Trump 2.0, what concerns are you hearing from customers? How are things different this time around? Has your perspective changed on the likelihood of increased tariffs and a possible trade war? And is there an upside with regard to additional complexity being good for Expeditors?
Answer: Our perspective is that shippers now know what to expect from a Trump administration. Tariffs were certainly a very real issue during his first term, when it often seemed that new rules were being issued nearly every day. But the reality is that many of the tariffs implemented during the first Trump administration were continued and, in some cases, tightened under the Biden administration. Historically, complexity has usually been very good for Expeditors. We are experts at helping our customers navigate complex environments.
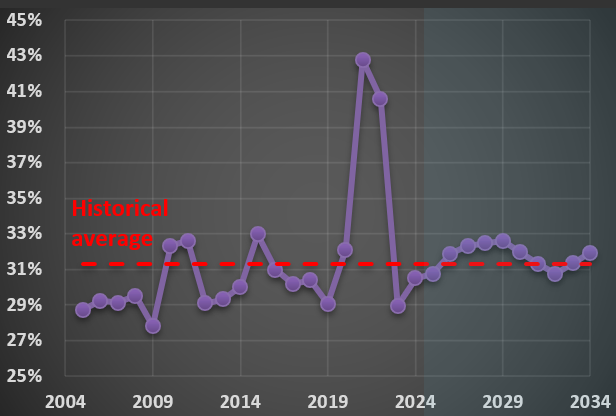
At the time, they didn’t know that the tariff changes in Trump’s first term would pale in comparison to what followed. It’s a reminder of how unpredictable economic cycles can be—and how companies must adapt swiftly. Below is a chart showing $EXPD’s historical and forecast net margin. 2021 and 2022 stand out as exceptional years; 2025 is projected to align closer to their long-term average. So far, the current tariff complexity hasn’t been “very good” for margins, but it hasn’t derailed the company, either.
Why “Simple” Numbers Lie: Lessons from $FDX and the Art of Financial Analysis
Why do I devote so much effort to detailed financial analysis of the companies in RIM’s CofC(*)? It’s because companies are constantly evolving, and off-the-shelf calculations like “sales growth” or “margin trends” frequently become meaningless in the real world.
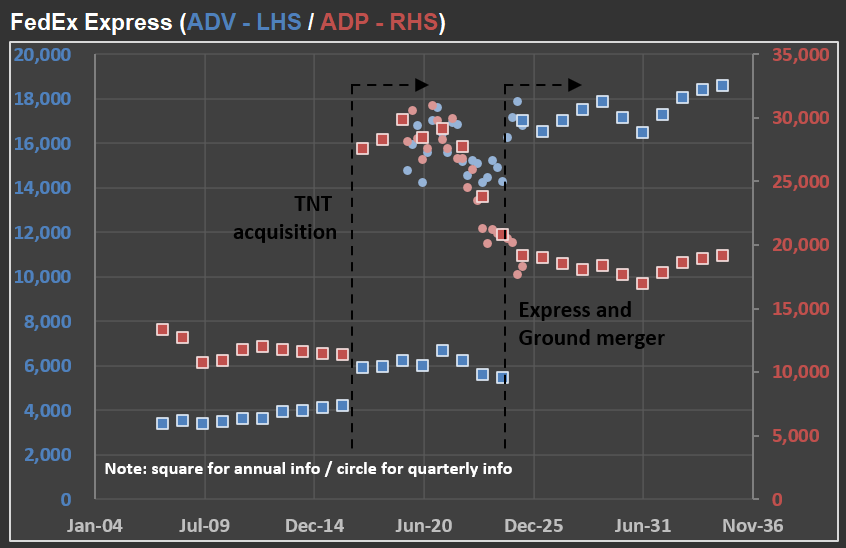
Take $FDX (FedEx) as an example. In the picture below, you’ll see how FedEx has reported ADV (Average Daily Volume) and ADP (Average Daily Packages) for their Express segment over the last 20 years, along with “base case scenario” forecasts for the coming decade.
First, notice the significant jump in ADP in 2017. That spike came right after the acquisition of TNT Express—a major European operator. The timing, however, was unfortunate: only months later, FedEx was hit by the NotPetya ransomware attack, which severely impacted TNT’s IT systems. Nearly every hub, facility, and depot had to have its systems rebuilt from scratch. The recovery was extensive, and FedEx estimated immediate losses of at least $300 million due to reduced shipping volumes, lost revenue, and higher remediation costs.
Fast-forward to recent years, and the numbers became complicated again. FedEx has merged its Ground and Express segments, moving closer to the model used by UPS (which already operates a unified network) and adjusting to changing parcel volumes after the ecommerce surge. Although no new company was acquired this time, the way FedEx reports its numbers has changed—once again making direct year-over-year comparisons challenging.
That’s why I continuously adapt my valuation models to account for these reporting changes. If I don’t understand exactly what changed (and when), the risk of producing misleading forecasts rises dramatically. Back to the model…
(*) CofC = Circle of Competence
$PCAR Update: Where Are We in the Heavy Truck Market Cycle?
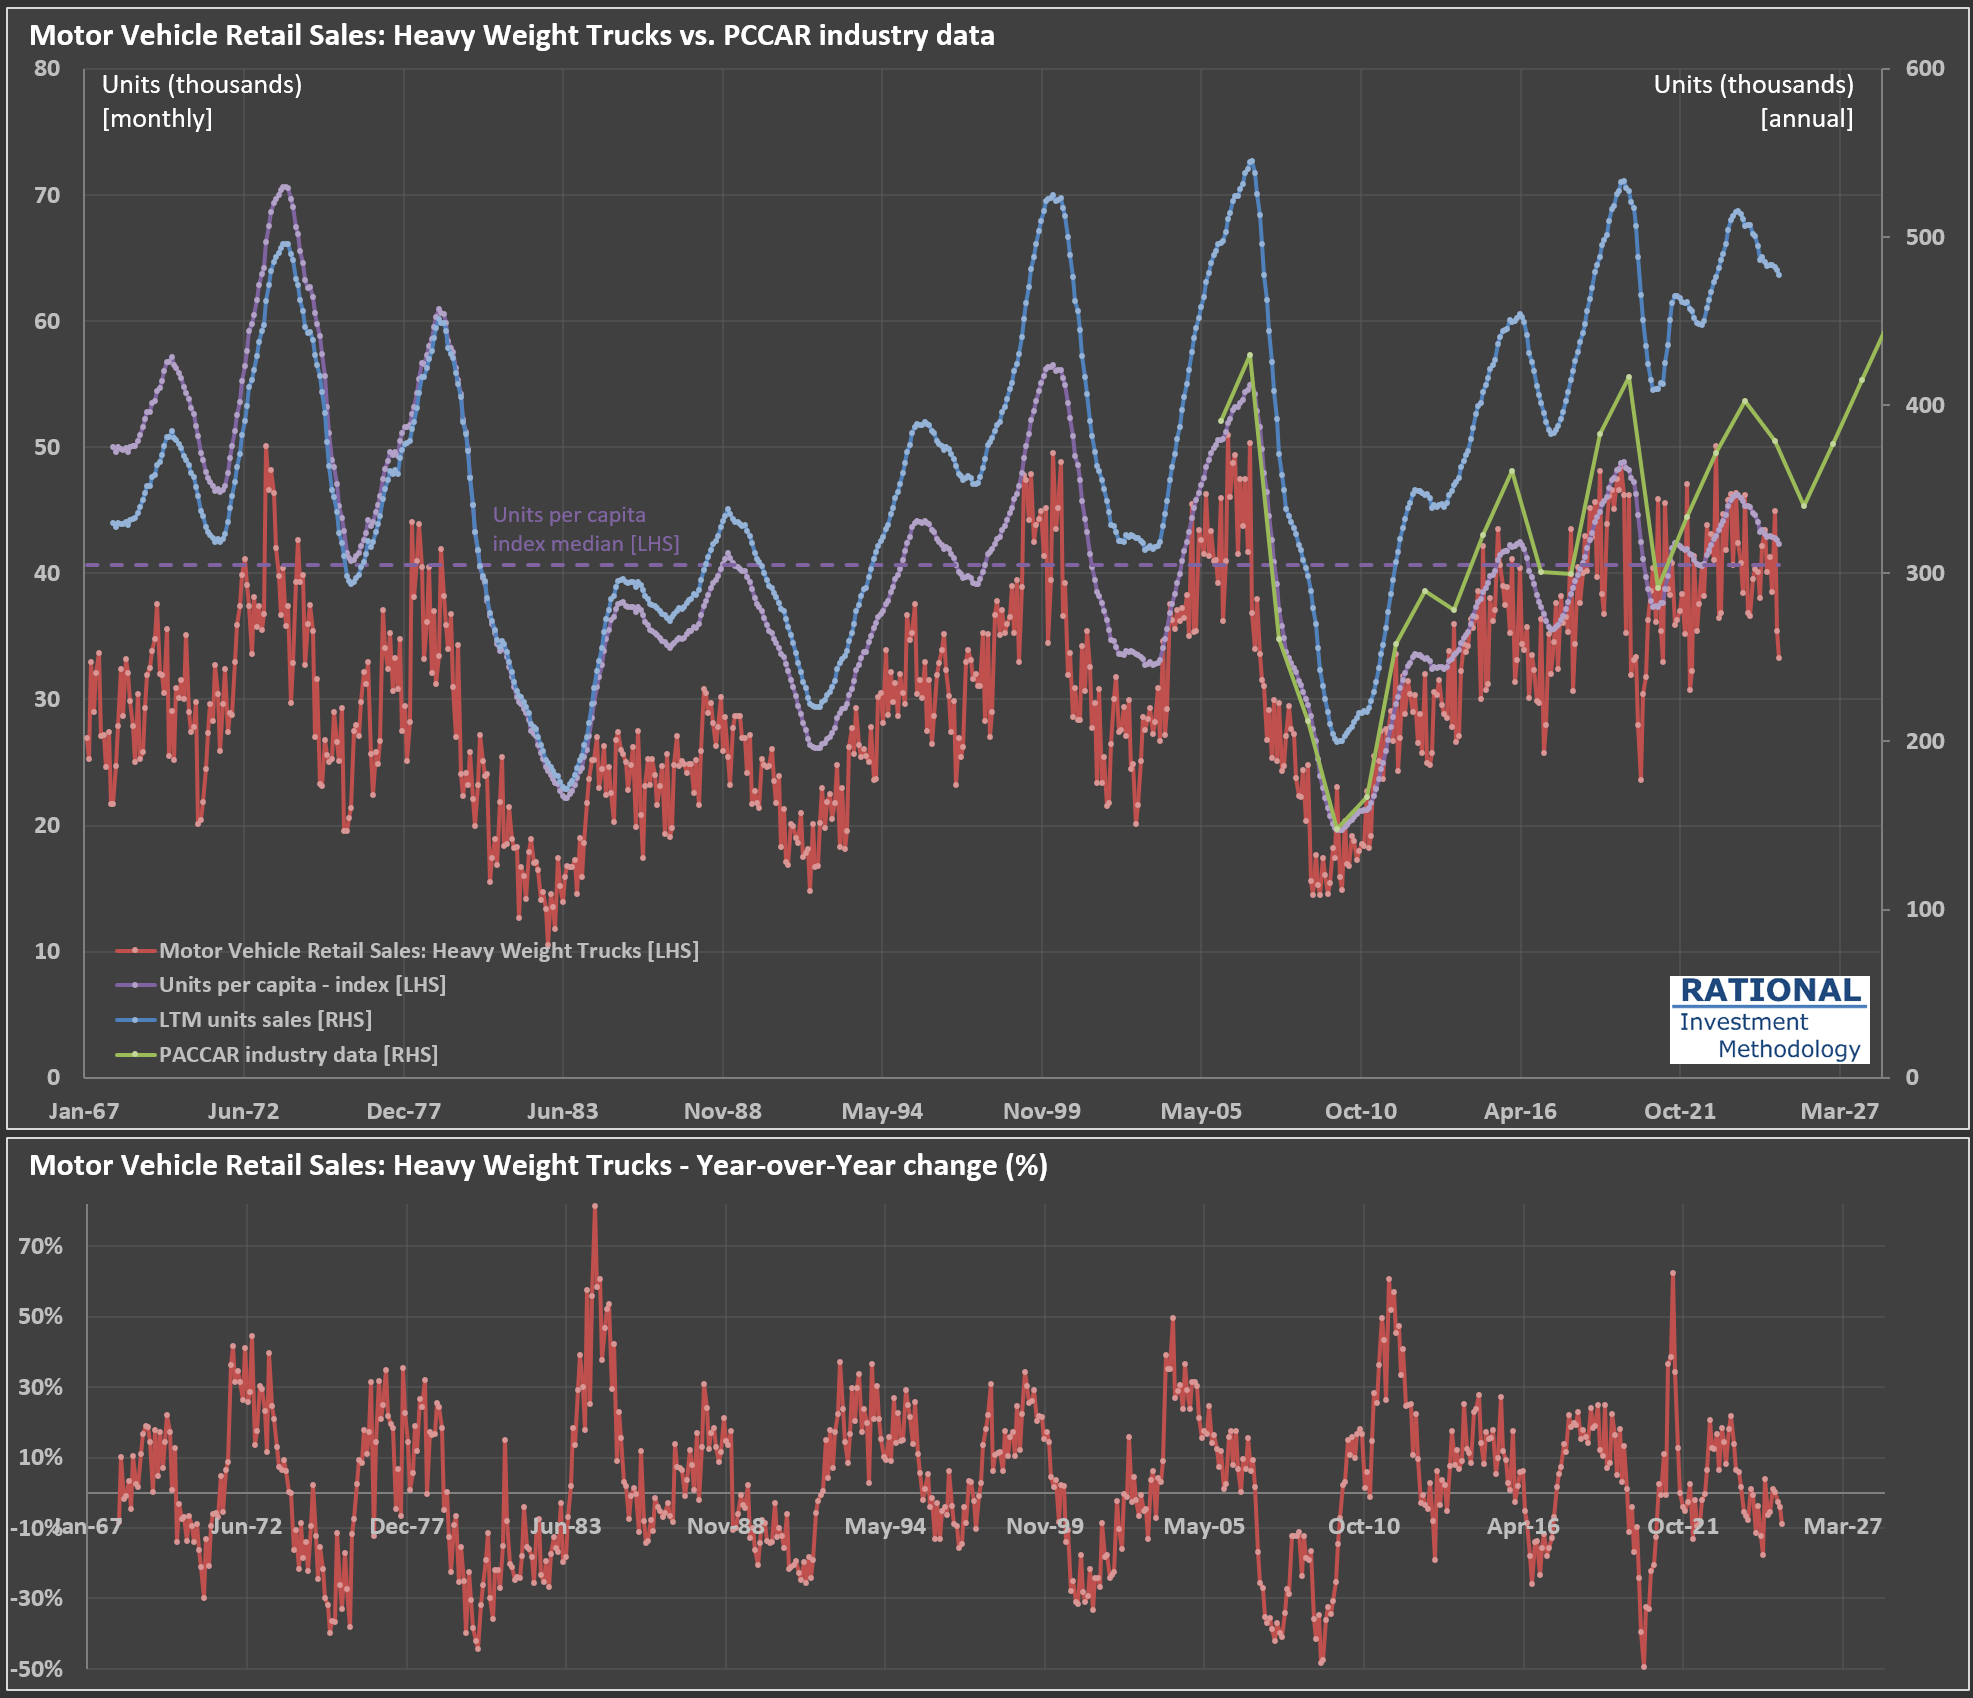
I’ve just finished updating my analysis on $PCAR (Paccar), a leading heavy truck manufacturer in the US. Much like my earlier post on Volvo trucks (here), $PCAR’s performance tends to mirror broader economic cycles.
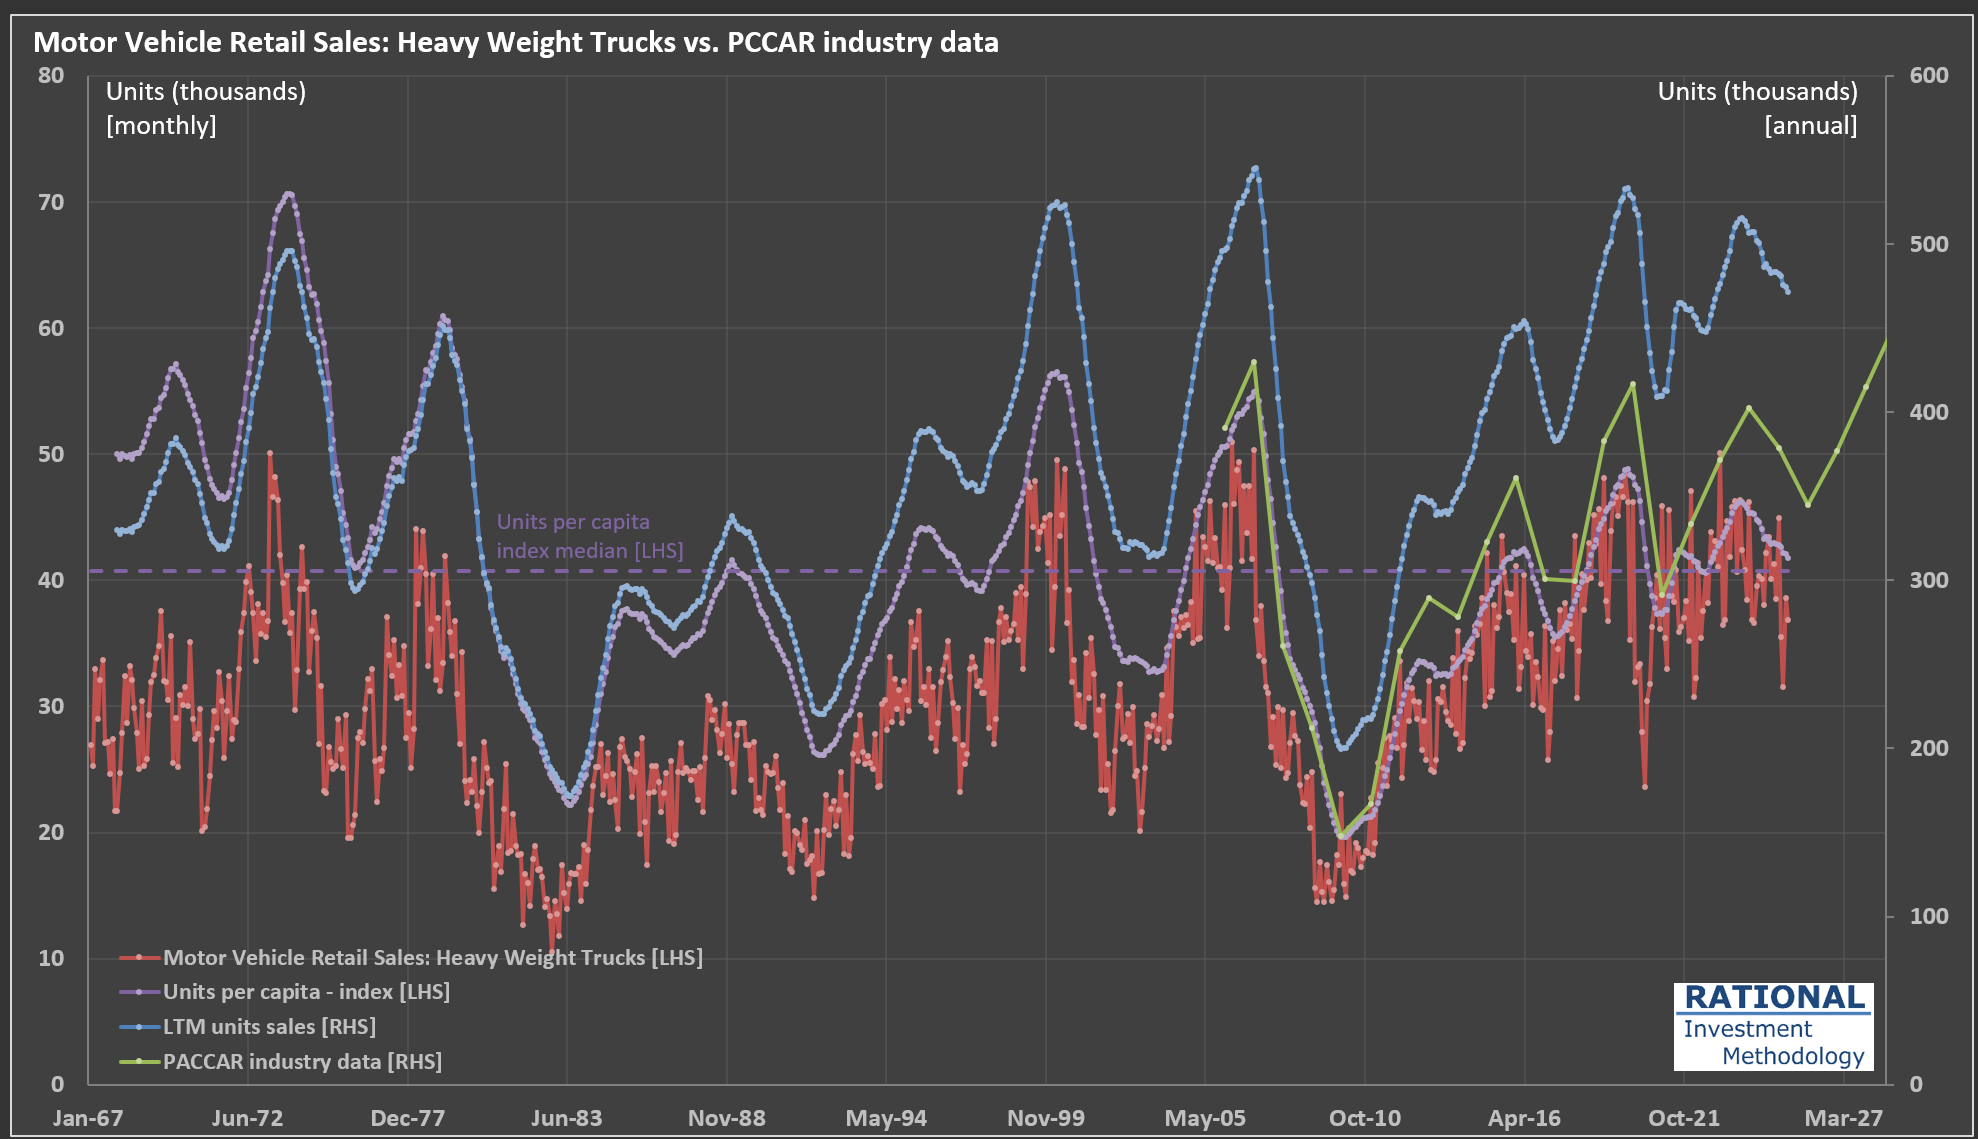
Take a look at the chart below:
The red line tracks monthly retail sales of heavy-weight trucks (in thousands of units, left axis). Because monthly figures can be quite volatile, I also include a rolling 12-month (LTM) sales figure—shown as the blue dashed line on the right axis (annualized, in thousands)—to help clarify the underlying cycle.
The green line represents PACCAR’s own industry data (also right axis). This closely follows the LTM sales trend, though there’s some divergence since PACCAR uses a slightly narrower market definition. Still, the correlation between the LTM data and PACCAR’s data is an impressive 97%, underscoring how similarly they reflect industry cycles.
Where does that leave us in the current cycle? The purple dashed line shows the units per capita index (left axis), which adjusts for population growth and offers a normalized view of demand over time. I’ve also marked the median value of this index on the chart, providing a useful benchmark to gauge whether current sales are running above or below historical norms.
At present, we’re in the second year of a downturn that began in late 2023. The pandemic era saw trucking companies enjoy strong profits, which led to a mini-boom in truck sales. Now, as we wait for 2Q 2025 earnings (due out in July), it will be interesting to see how the latest round of tariffs impacts the industry. Stay tuned.
Gauging the Downturn: Volvo, $SAIA, $ODFL, $PCAR, and the State of US Trucking
I’ve just finished updating my analysis for Volvo (the truck manufacturer-not the car company). While Volvo isn’t American (most RIM companies are US-based, with only two exceptions), I follow it closely because it owns Mack, one of the leading truck brands in the US.
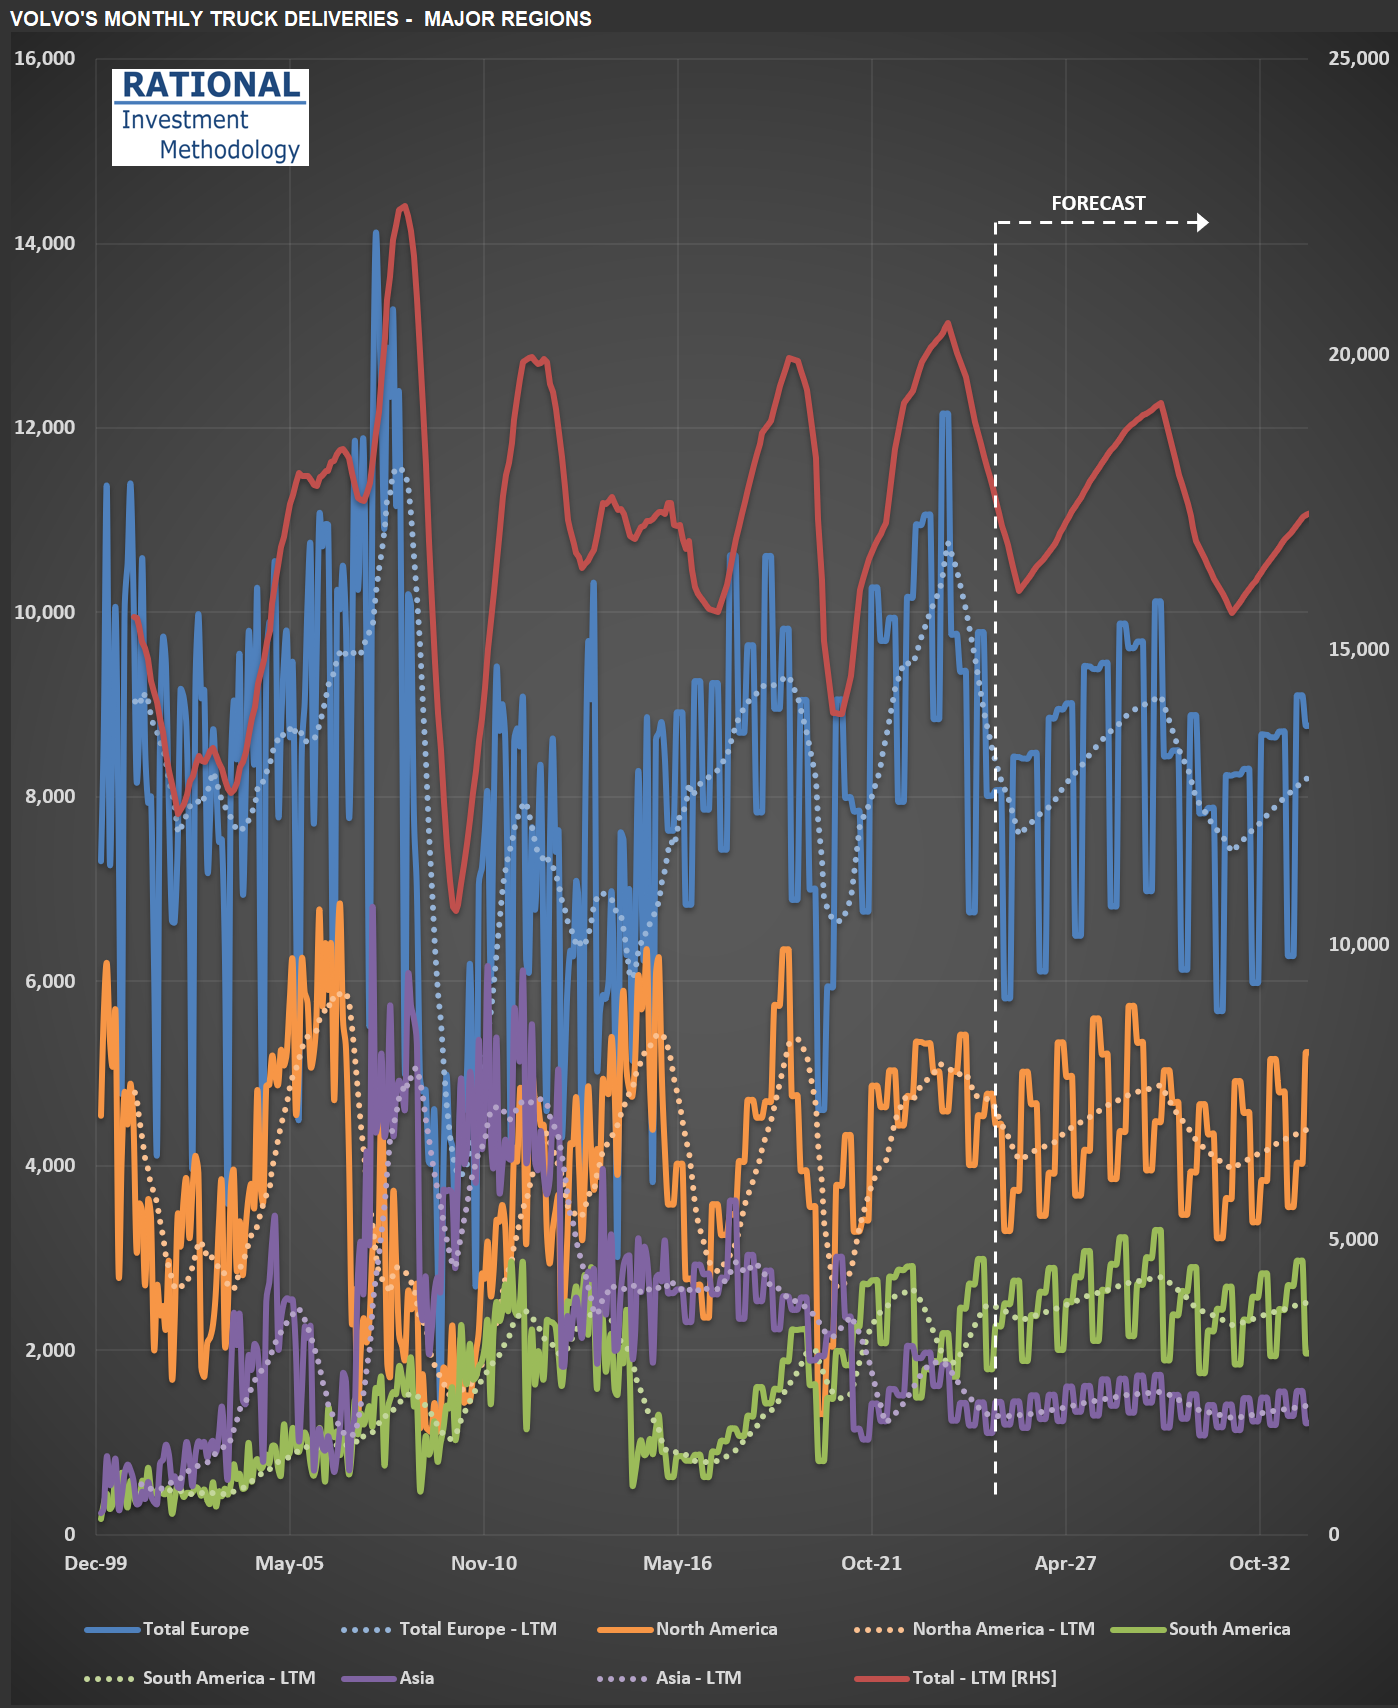
Take a look at the chart below, which shows truck deliveries across Volvo’s major regions. The first thing to note is the industry’s cyclical nature-transportation companies tend to move as a herd when it comes to ordering more (or fewer) trucks. You’ll see that we’ve been in a downturn recently (just before the vertical dotted white line). But here’s what Volvo’s CEO said during the latest conference call, just a few days ago:
“…the increased hesitation among customers in North America to place orders given uncertainty in general. We are, therefore, as we speak, adjusting production levels for group trucks North America to minimize the under-absorption in production going forward.”
In other words, the recent shake-up in economic and market conditions has made Volvo’s customers more cautious. It doesn’t help that today, shares of $SAIA (a major LTL* operator in the US and competitor to $ODFL, which is part of RIM’s CofC**) dropped more than 30% after missing earnings estimates by a wide margin.
I’ll be watching Volvo’s truck deliveries closely-they’ll provide a useful signal for how deep this current downturn might get. This will also help me calibrate my ongoing analysis of $PCAR, another major player in the US and European truck manufacturing market.
(*) LTL = Less Than Truckload (**) CofC = Circle of Competence
Tracking $EXPD Through the Global Tariff Storm
I’m working on Expeditors International of Washington, Inc. ($EXPD) today. $EXPD is a Fortune 500, non-asset-based logistics company providing highly customized global supply chain solutions—including air and ocean freight forwarding, customs brokerage, warehousing, and distribution—through a network of more than 340 offices in over 100 countries. The company employs around 18,000 people.
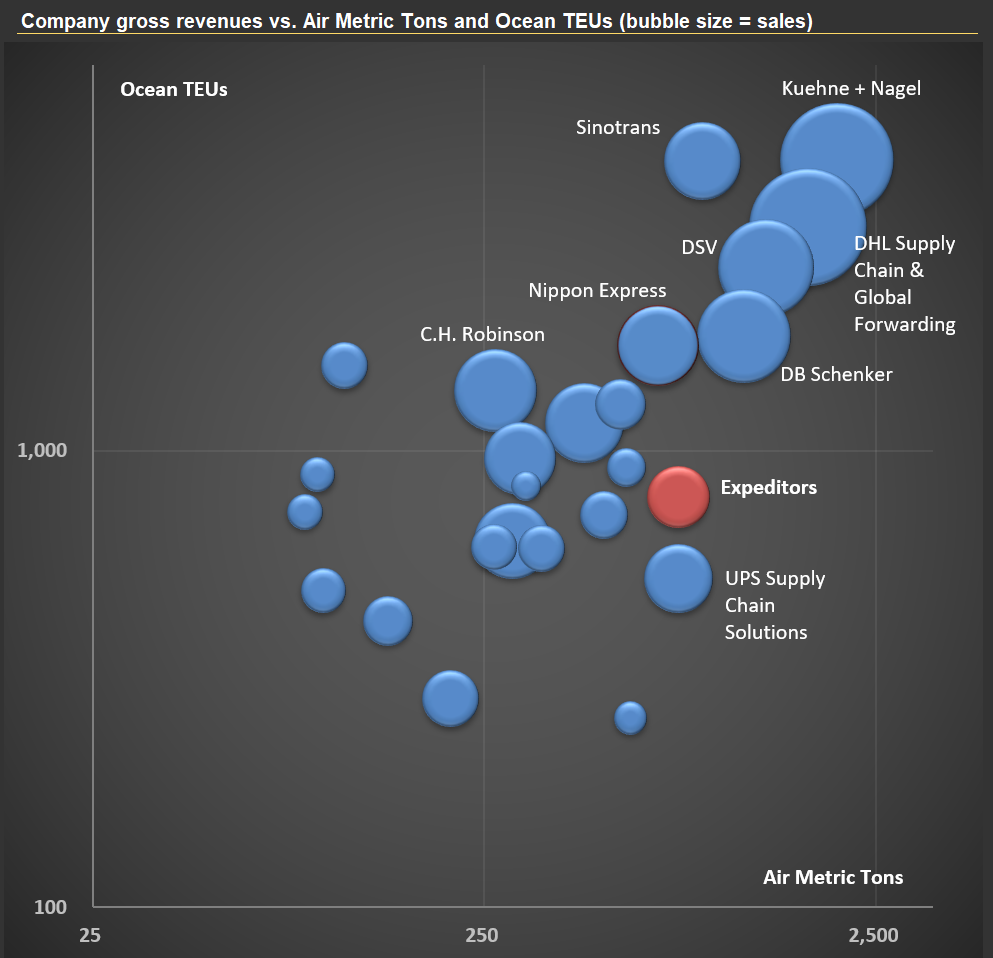
The “non-asset-based” model in logistics means that $EXPD does not own the trucks, ships, planes, or warehouses used to move and store goods. Instead, it acts as an intermediary, leveraging a broad network of third-party carriers and service partners to coordinate and manage logistics operations for clients. This approach offers flexibility and scalability, allowing $EXPD to tailor solutions, adapt quickly to changing demands, and often reduce costs by avoiding the burden of maintaining its own fleet or facilities. In the first picture below, you’ll see the top 25 players in the global logistics sector, with $EXPD highlighted in red.
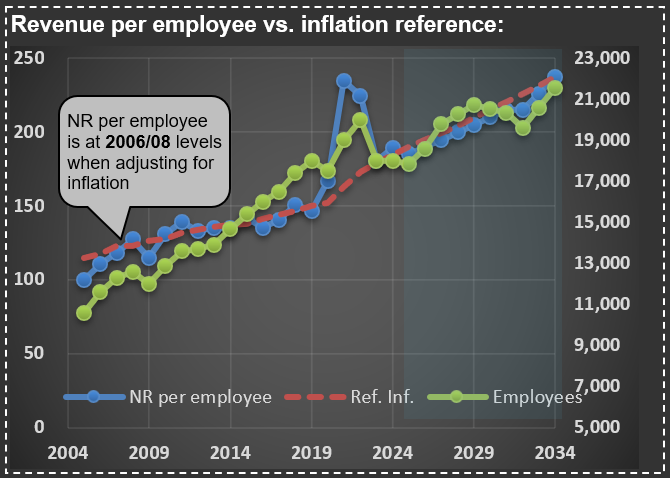
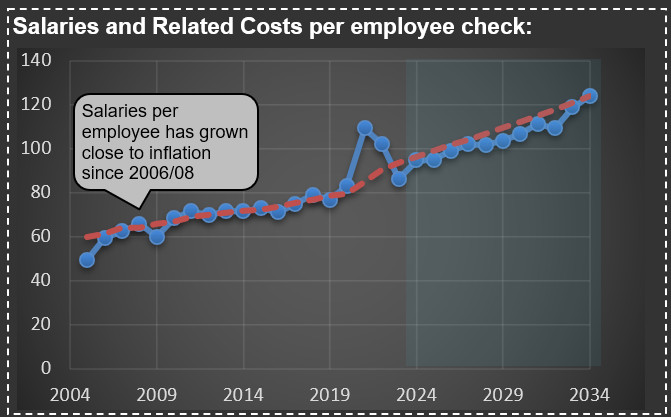
One aspect of $EXPD’s business that stands out—see the next two charts—is how little its “Net Revenue” (revenue excluding pass-through transportation costs) and employee compensation have changed in real terms over the past 20 years. Adjusted for inflation, both metrics are essentially at the same level as they were two decades ago. Intuitively, I would have expected costs per employee to decline, given the advances in computing power and process automation during this period.
The lesson: trust your intuition less, and make sure you have enough information to understand what’s actually driving a company’s revenue and costs. I’ll be watching $EXPD and its competitors closely—they’re at the center of the ongoing global tariff disputes, and their financials should eventually reflect the consequences of any shifts in the rules of the game
What's Driving PACCAR's ($PCAR) Recent Sales Slowdown?
I’m analyzing $PCAR (PACCAR Inc.) today, a leading trucking manufacturer in the US and Europe. Check out the chart below—it illustrates several key data series. The red line represents monthly sales of heavy-weight trucks in the US (in thousands of units; from the U.S. Bureau of Economic Analysis via the FRED system). The blue line (scale on the right) shows cumulative truck sales over the last twelve months (LTM).
Ideally, this LTM series should closely track PACCAR’s industry sales data (green line)—they are close but not equal, as the data from the FRED system encompasses a broader category of trucks. Indeed, the correlation between these two series (blue and green) is quite high at 96%. This means we can reliably use monthly U.S. Bureau of Economic Analysis data to anticipate PACCAR’s sales trends.
Recent figures indicate a slowdown following exceptionally strong post-pandemic sales. Trucking companies earned unusually high profits during the pandemic (as discussed in my previous post here), prompting them to order trucks aggressively. With freight rates normalizing and transported volumes below trend, these companies are dialing back their purchases. Consequently, manufacturers like PACCAR are experiencing declining earnings.
Interestingly, this current cycle hasn’t been particularly severe. Notice the purple dotted line—it measures truck sales per capita in the US. Over the past decade or so, sales cycles have become relatively muted, even when factoring in pandemic-related volatility (the bottom chart shows year-over-year changes clearly). Imagine how challenging it must be for manufacturers to manage operations amid such fluctuations.
Is CSX's Growth Engine Losing Steam?
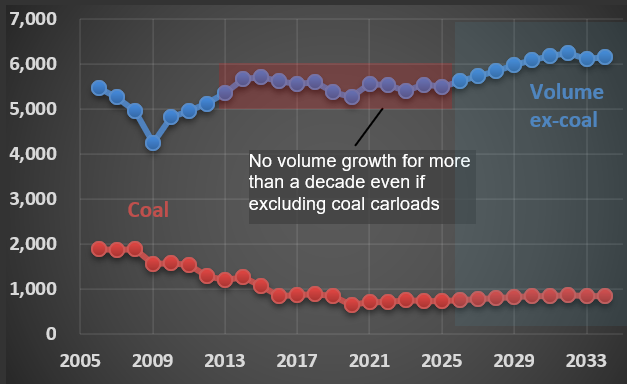
I’m currently analyzing $CSX (CSX Corporation), one of the leading railroad operators in the US. Look at the chart below: the red line represents coal carloads, which have significantly declined over the past two decades as the country transitions away from coal as an energy source.
The blue line shows carloads for all other industries CSX serves—think chemicals, materials, minerals, forest products, automotive (from parts to finished vehicles), and intermodal containers (those versatile boxes that seamlessly move between trucks, trains, and ships). Interestingly, volumes for these categories have remained relatively flat over the last 13 years.
Yet, despite stagnant volumes, CSX’s earnings per share—and consequently its share price—have risen considerably during this period. This growth has primarily been driven by aggressive cost-cutting measures and consistent price increases, enabled by the duopoly structure common among railroads. However, recent slow declines in margins could suggest that this favorable dynamic is beginning to shift.
J.B. Hunt's Equipment Dilemma: Pandemic Expansion Meets Post-Boom Reality
Look at what $JBHT management said during the last conference call: “…we still have really significant capacity that’s underutilized. And the cost to store that equipment is a significant headwind for us. And so as we continue to scale and grow our volumes, while also improving pricing, that’s going to be our focus and our effort. The Walmart equipment, we reported – I think we reported just over 122,000 containers at the end of 4Q. When we onboarded the Walmart equipment, all of that equipment requires a modification and we haven’t completed that work. Clearly, we just did the acquisition in, I think, the second quarter of – or end of first quarter, second quarter last year. And that equipment is tucked away in storage right now because frankly, we’re still trying to grow into the 122,000 containers that you can see we own today.”
This was a classic over-investment situation, given the strong cycle for trucking companies during the pandemic (mostly on pricing, as companies were willing to pay anything to secure transportation capacity). The result: a very low “Net PP&E turnover”—see the blue line on the chart. It is as low as in the deep recession years of 2009.

J.B. Hunt: Share Price Defies Earnings Gravity - Market Optimism or Pandemic Memory Bias?
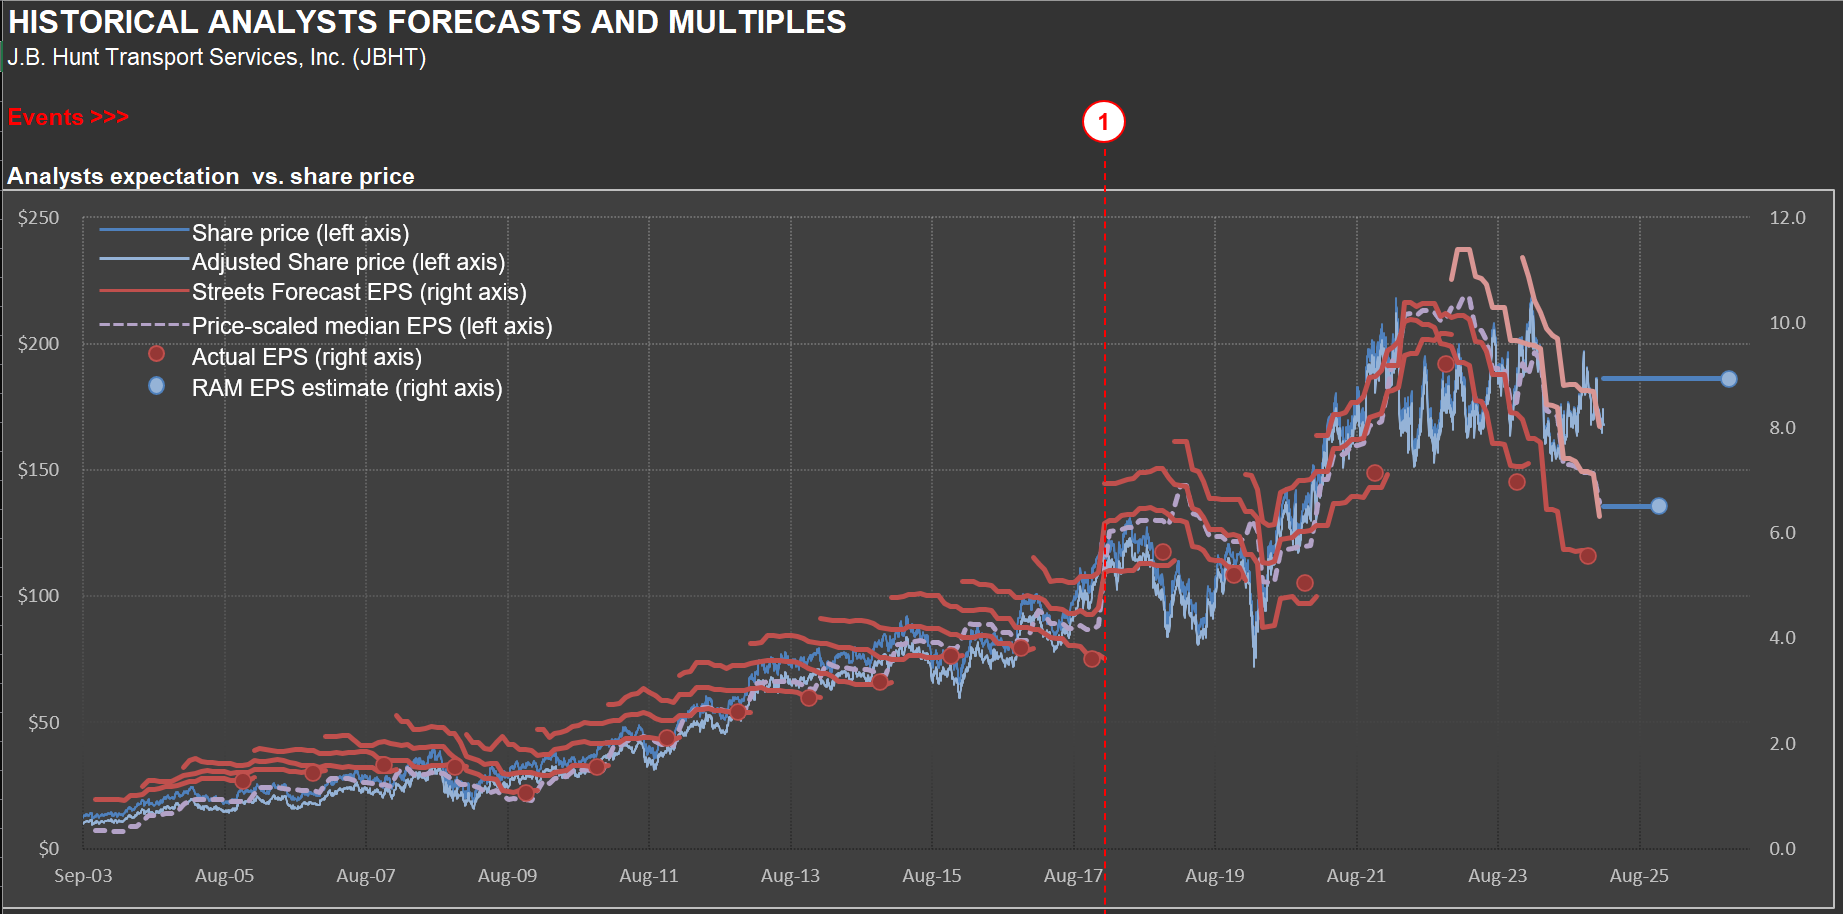
For most companies, share prices follow short-term EPS (in other words, the Market doesn’t anticipate much—it just reflects what it sees “as of now”). It isn’t different for $JBHT — see how the share price follows expected EPS on the chart. However, the current market price appears to be fighting a substantial decline in earnings. Maybe it’s because trucking companies made a disproportional amount of money during the pandemic, biasing some investors regarding how much they are willing to pay for J.B. Hunt’s earnings.
Fleet Age Dynamics: How J.B. Hunt's Minor Aging Shifts Drive Major Truck Purchase Swings
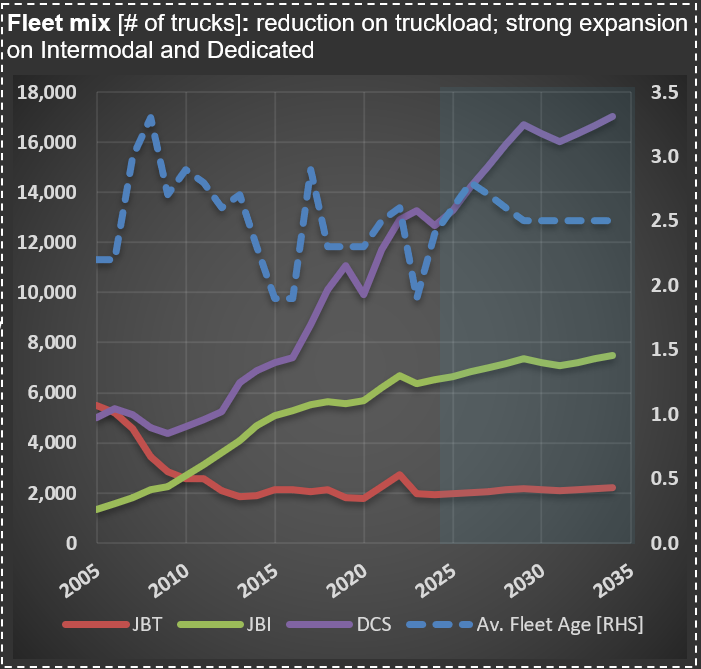
I’m working on $JBHT [J.B. Hunt] today. It is incredible how relatively small fluctuations in the average age of a trucking company’s fleet (represented by the dashed blue line on the chart) change the demand for new trucks. The company went from buying almost 6,000 trucks in 2021/2022 to something close to 3,600 trucks now.
Trucking Tonnage Trends: What ATA Data Reveals About Economic Momentum
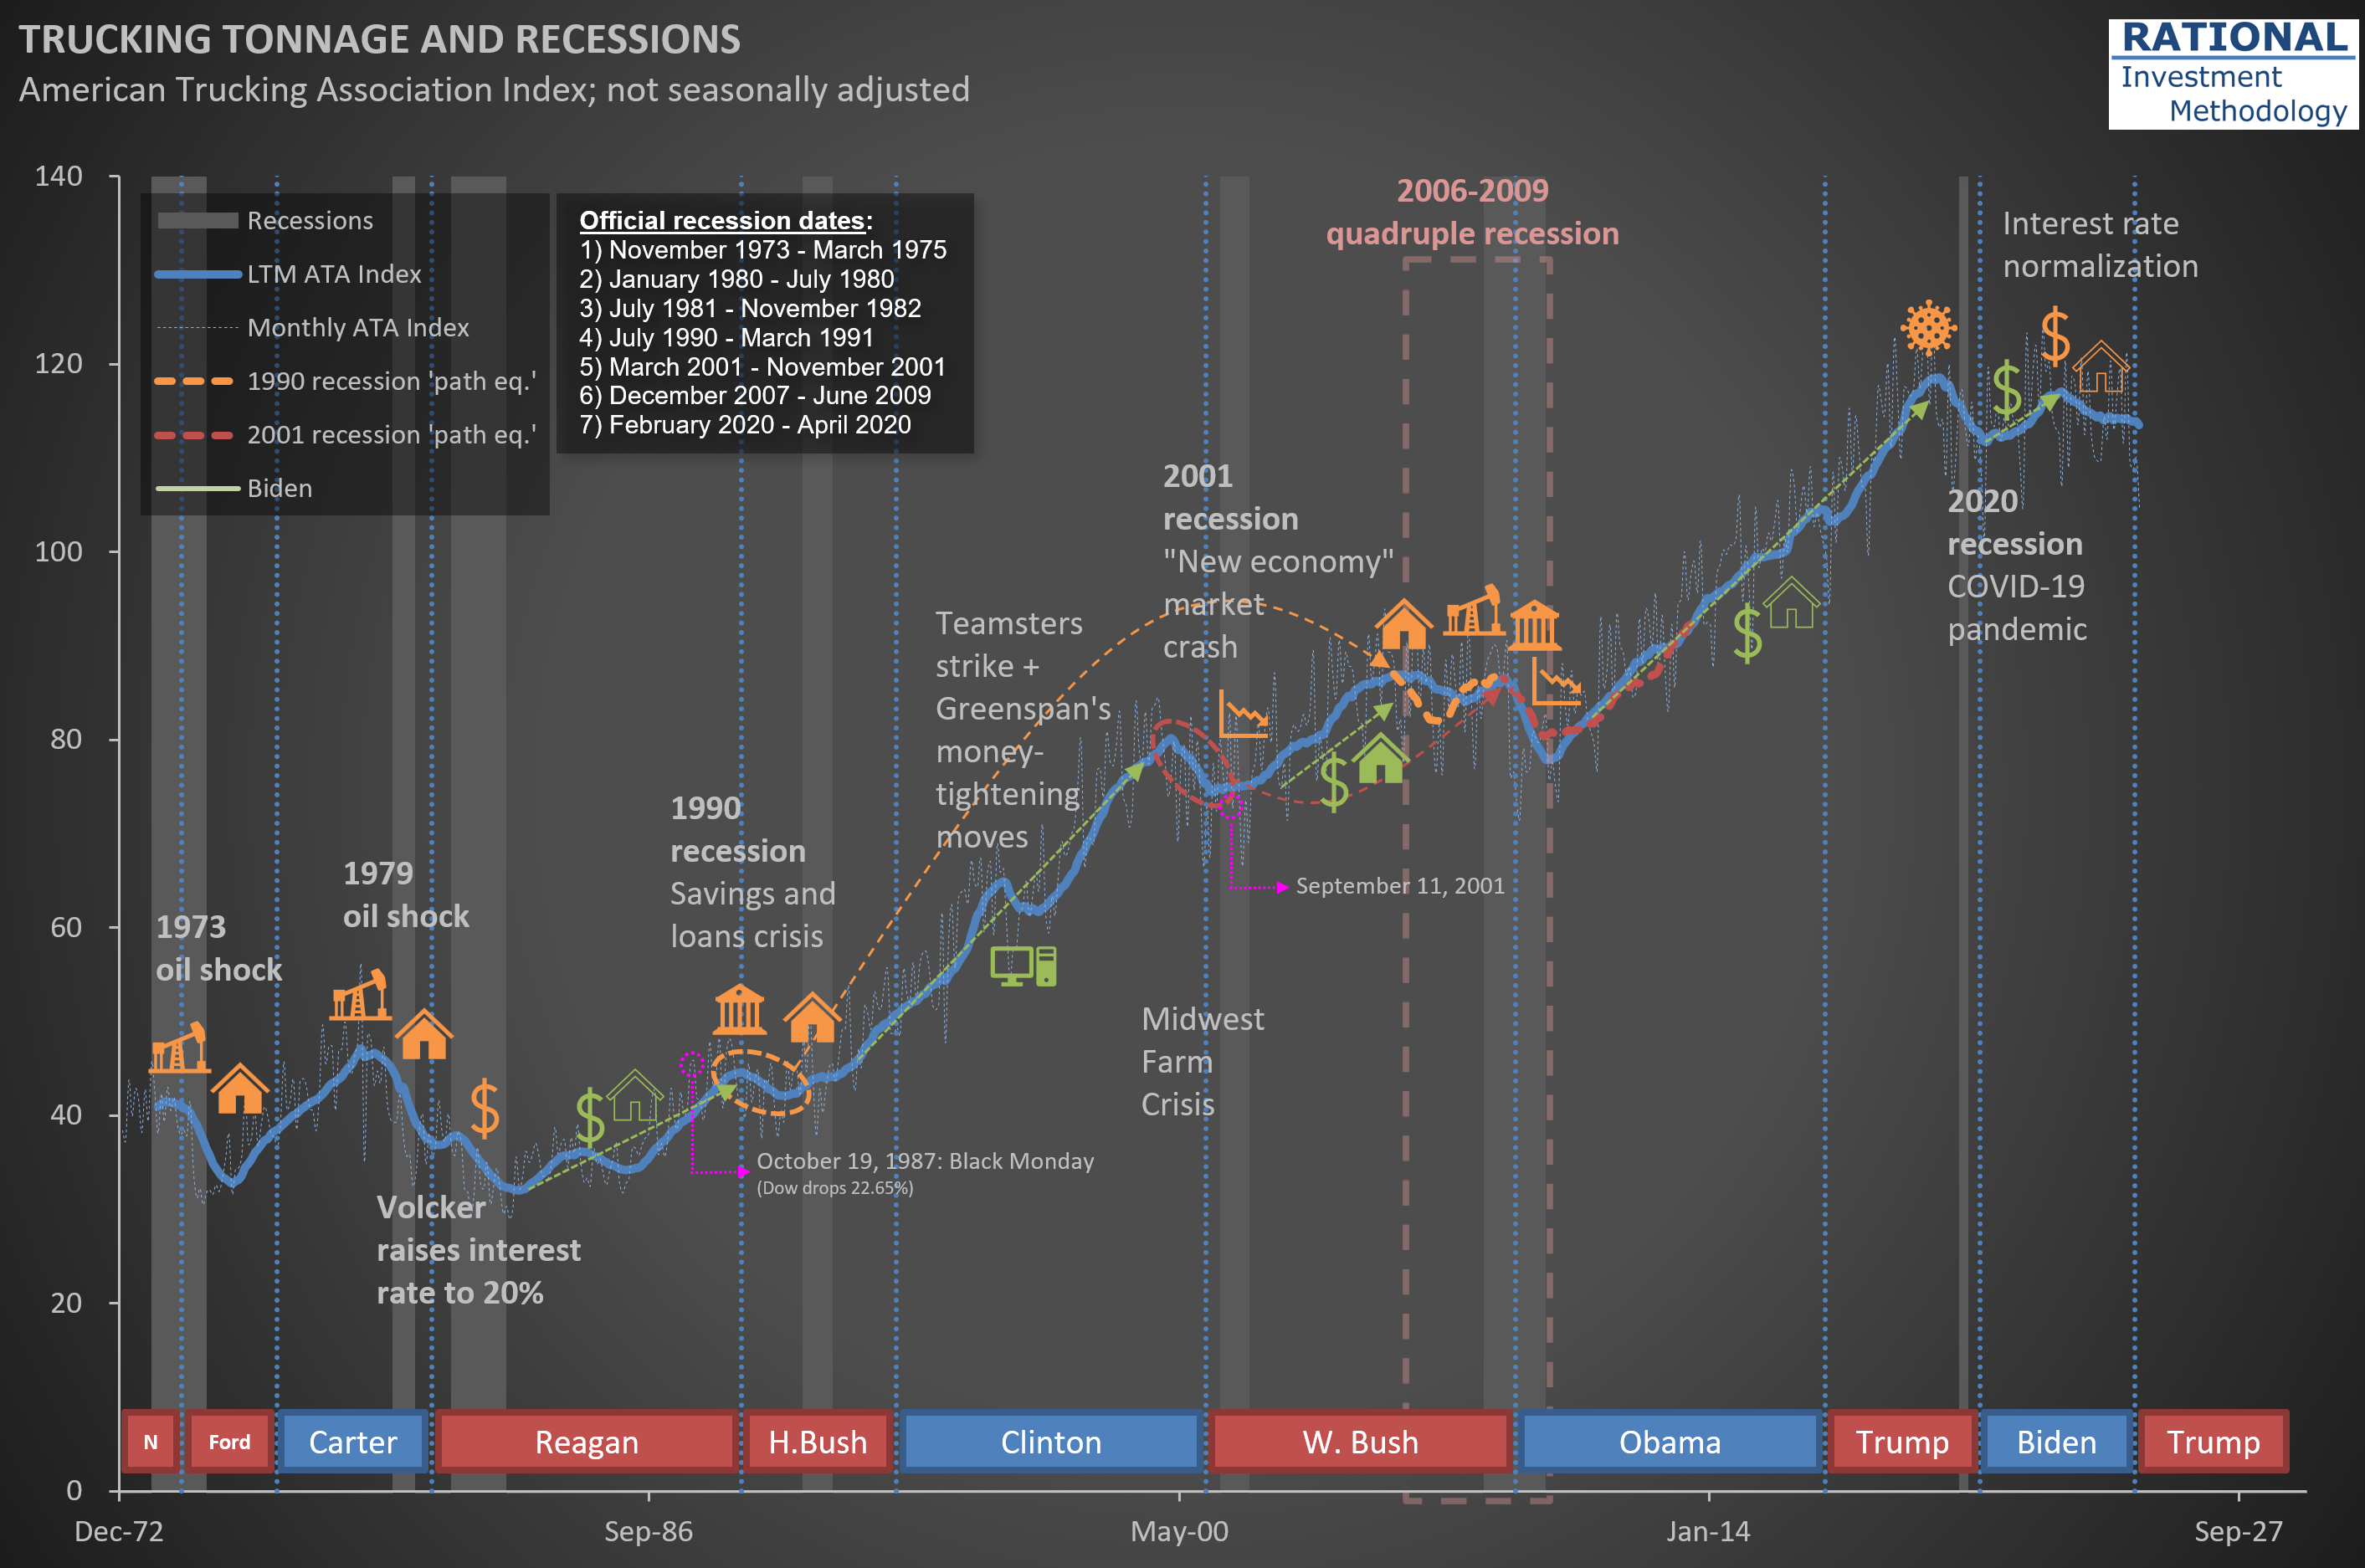
Trucking tonnage data from the American Trucking Association (ATA) reveals a persistent sluggishness in demand for trucking services. Take a look at the long-term perspective in the chart below, which helps contextualize current industry conditions within historical patterns.
The visualization offers valuable insights into freight movement trends—often considered a bellwether for broader economic activity. For those monitoring economic signals, this data point merits attention alongside other indicators when evaluating the current business cycle position.
