Transportation
Did $EXPD Miss the Storm? Lessons from Their Q&A
As I updated my work on $EXPD (Expeditors; I discussed the company’s business in a prior post—here), I searched for their latest Q&A documents. Expeditors doesn’t host analyst conference calls, but you can send them questions that management periodically responds to. The most intriguing responses came from their January 13, 2025, Q&A.
What stood out was how a group of logistics specialists didn’t anticipate the tariff storm that was about to hit the industry. Here’s the exchange:
Question: Regarding Trump 2.0, what concerns are you hearing from customers? How are things different this time around? Has your perspective changed on the likelihood of increased tariffs and a possible trade war? And is there an upside with regard to additional complexity being good for Expeditors?
Answer: Our perspective is that shippers now know what to expect from a Trump administration. Tariffs were certainly a very real issue during his first term, when it often seemed that new rules were being issued nearly every day. But the reality is that many of the tariffs implemented during the first Trump administration were continued and, in some cases, tightened under the Biden administration. Historically, complexity has usually been very good for Expeditors. We are experts at helping our customers navigate complex environments.
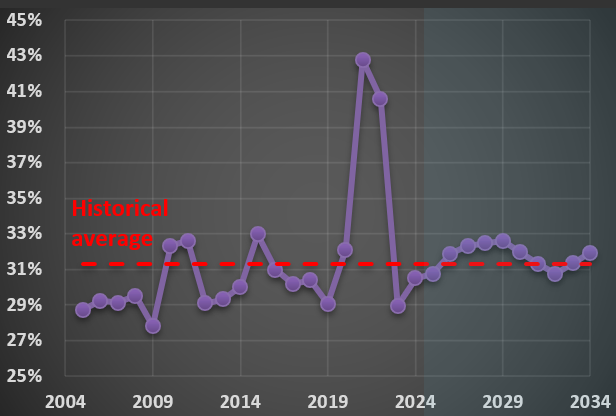
At the time, they didn’t know that the tariff changes in Trump’s first term would pale in comparison to what followed. It’s a reminder of how unpredictable economic cycles can be—and how companies must adapt swiftly. Below is a chart showing $EXPD’s historical and forecast net margin. 2021 and 2022 stand out as exceptional years; 2025 is projected to align closer to their long-term average. So far, the current tariff complexity hasn’t been “very good” for margins, but it hasn’t derailed the company, either.
The Cass Transportation Index: Interpreting the New Wave of Red
A few months ago, I introduced you to the Cass Transportation Index. If you’d like a refresher on the various time series Cass releases, you can revisit my earlier post here.
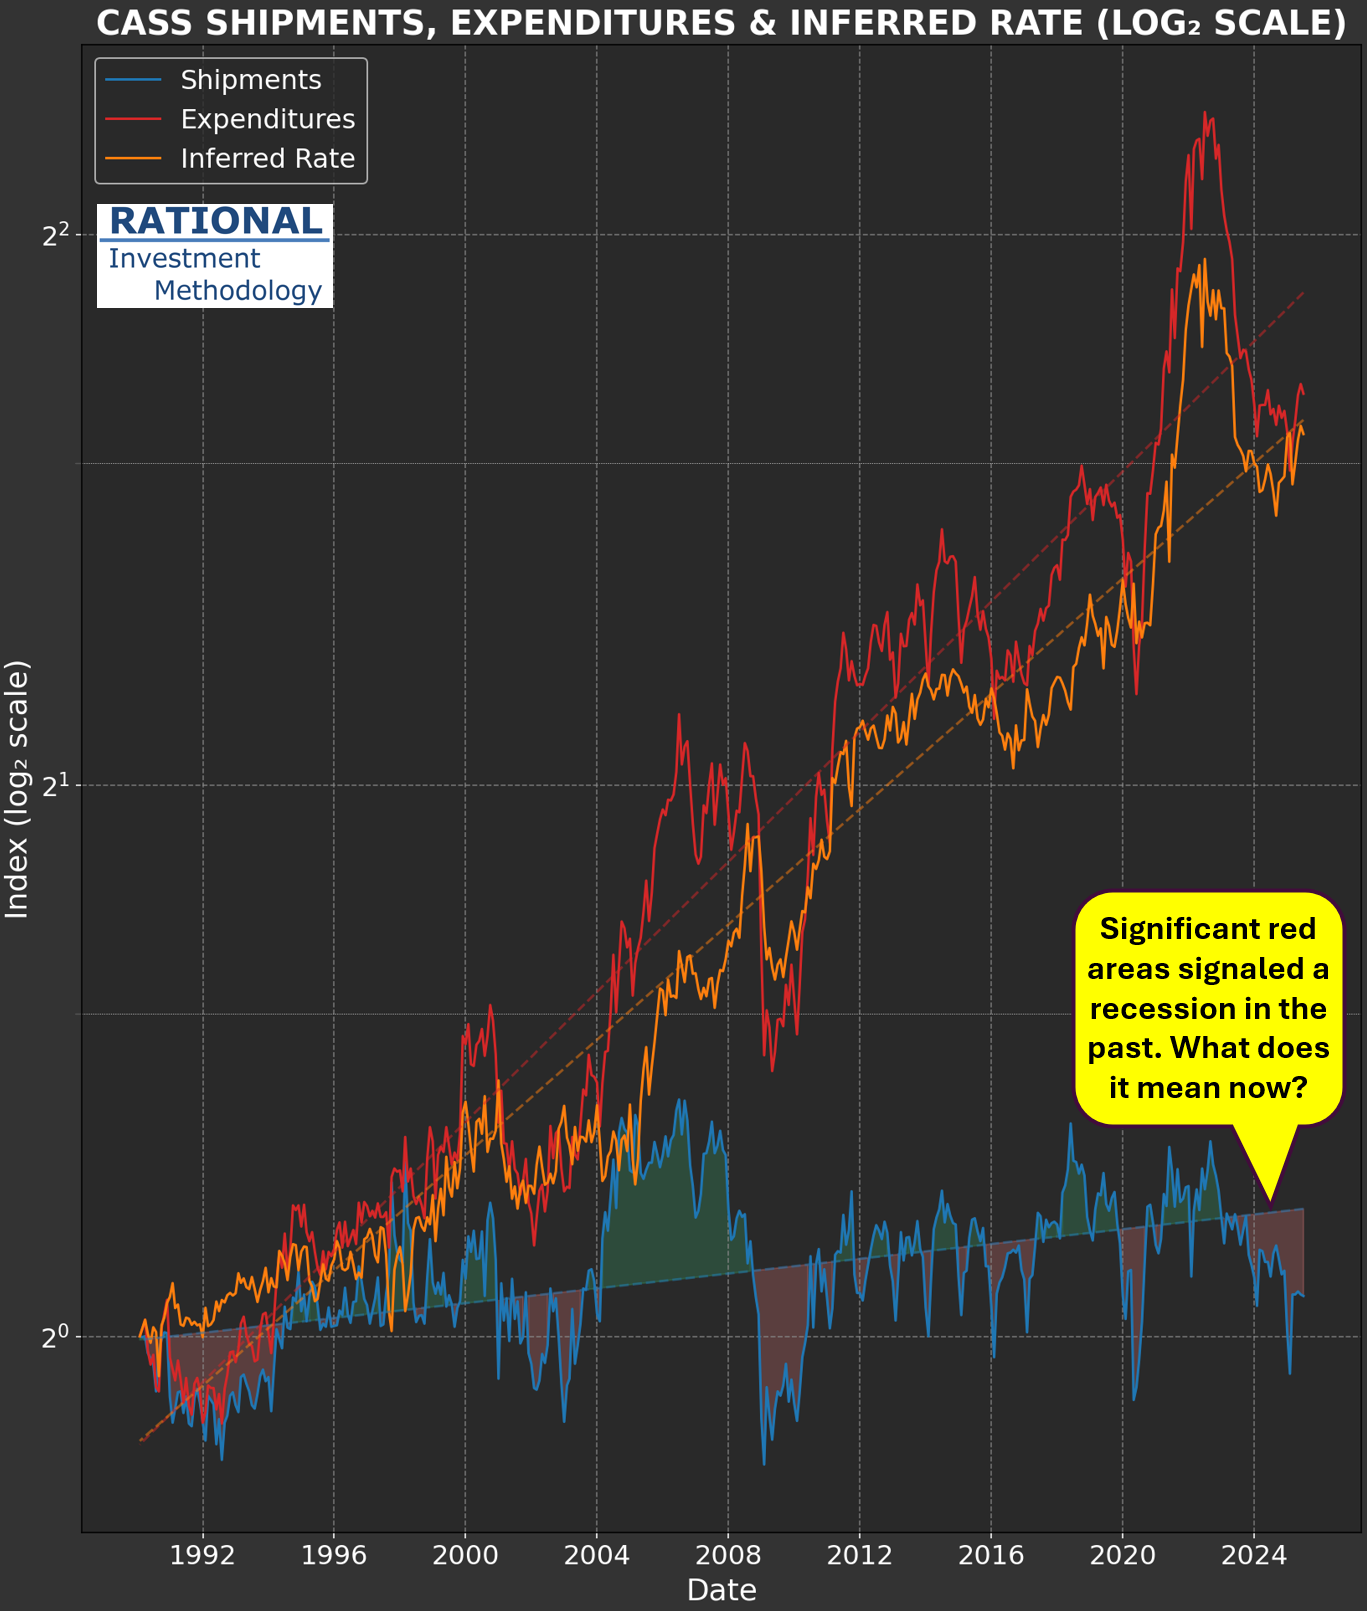
Today, I’m turning the spotlight to the shipments series—take a look at the chart below. The line in blue tracks shipments and has now logged its 29th consecutive negative year-over-year print. For this update, I opted to display the series as-is (in my previous chart, I had multiplied it by three) to emphasize the significant inflation we’ve seen in U.S. transportation services. Simply put, shipment volumes have increased far less than costs (as illustrated by the red line). The primary factor here is the sharp rise in the “inferred rate,” which reflects the actual price that shippers are paying to move goods.
You’ll also notice on the blue series: whenever the data runs above the trendline, the gap turns green. When it dips below, the area is filled with red. Historically, when the red area became substantial, it coincided with recession—think early 1990s, late 2000s, and the coronavirus pandemic period. Conversely, a dominant green area marked periods of above-trend economic activity, most notably in the early/mid-2000s during the first housing bubble.
So, what should we make of the fact that the red area is now so pronounced? Is this recession territory? If so, why don’t GDP figures show a slowdown? At first, you could argue it’s the economy “working off” the excesses of the pandemic. But this red patch is already much larger than the green area seen when government stimulus was being poured out. Even if we start to see a recovery in transportation volumes, the size of the red area will continue to grow for some time yet.
As earnings season gets underway, I’ll be watching closely for commentary from companies regarding overall activity levels. I sense that few will sound especially optimistic about the landscape in their sector.
$PCAR Update: Where Are We in the Heavy Truck Market Cycle?
I’ve just finished updating my analysis on $PCAR (Paccar), a leading heavy truck manufacturer in the US. Much like my earlier post on Volvo trucks (here), $PCAR’s performance tends to mirror broader economic cycles.
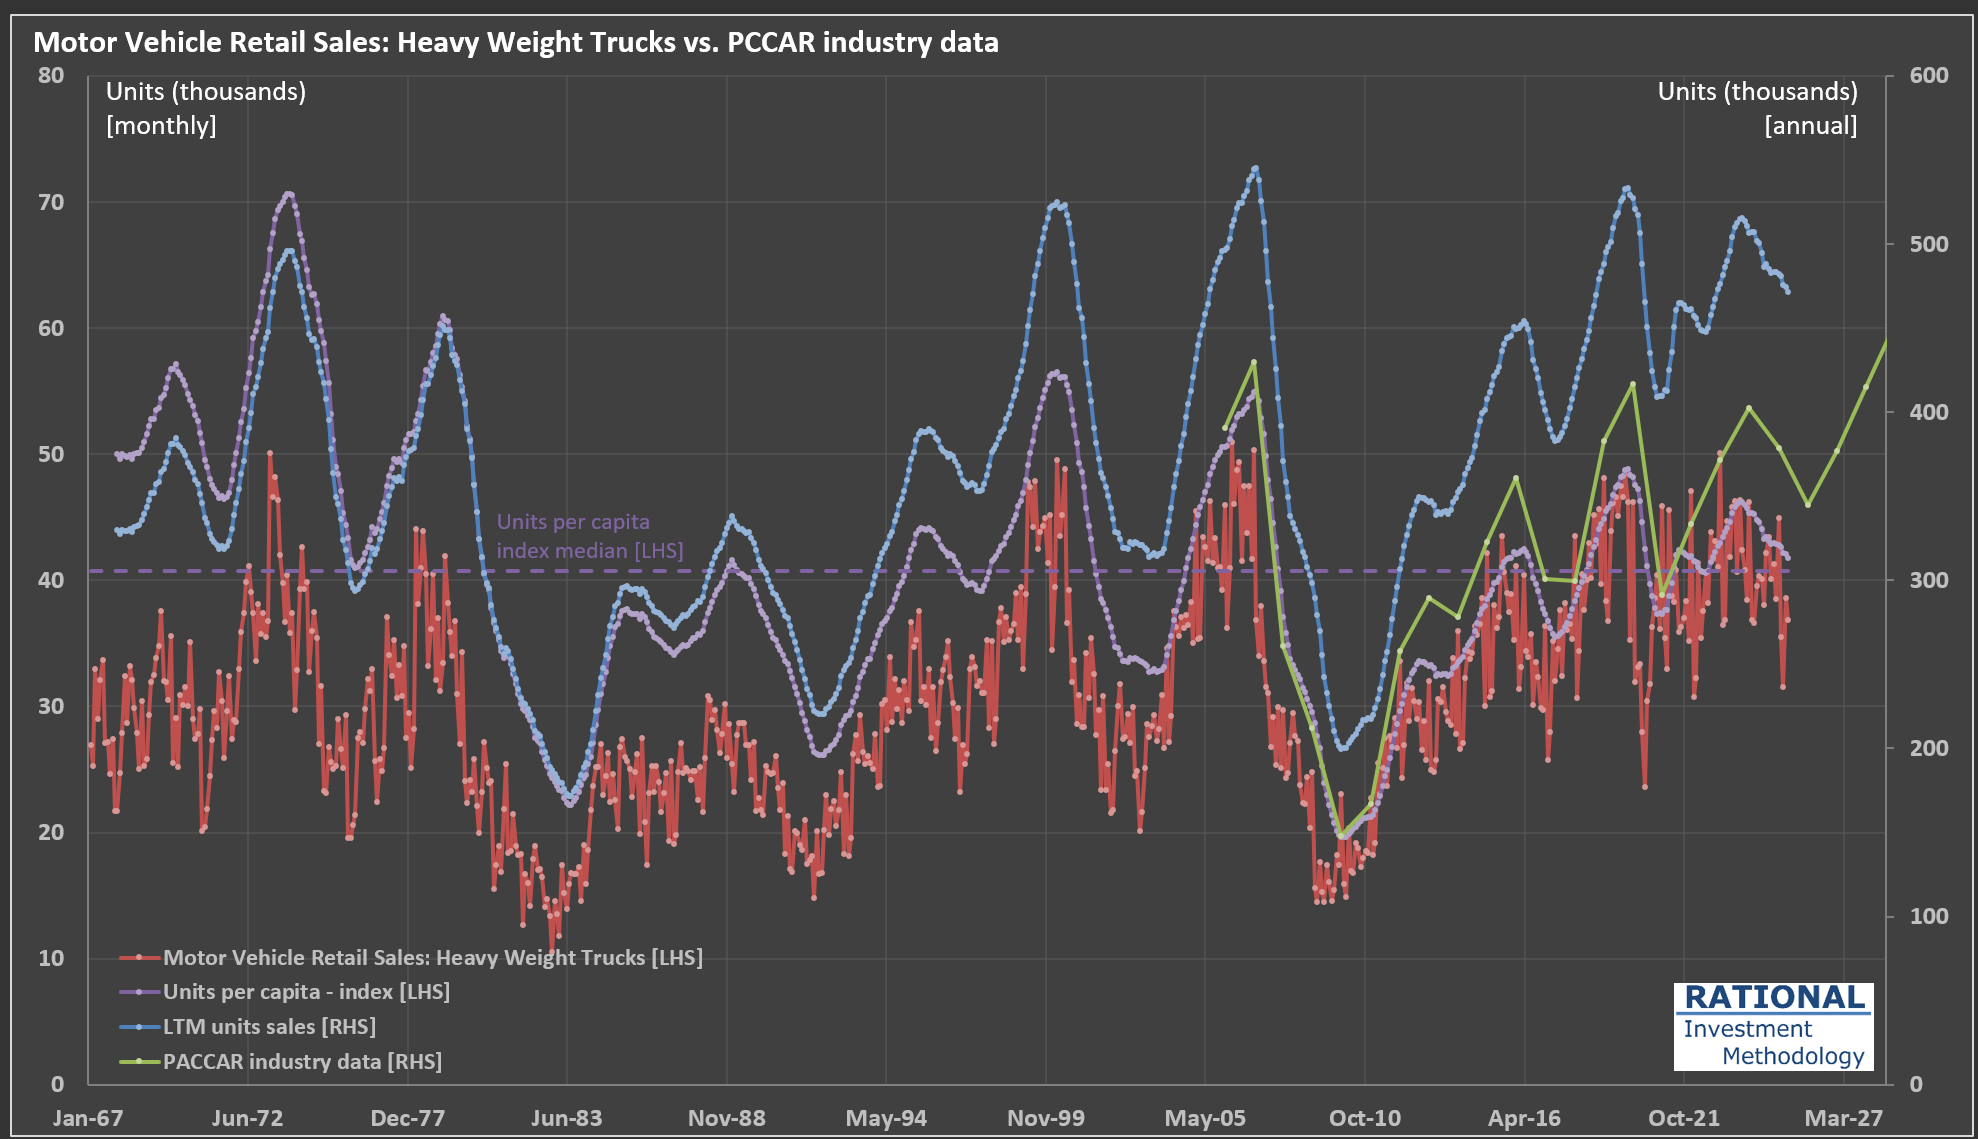
Take a look at the chart below:
The red line tracks monthly retail sales of heavy-weight trucks (in thousands of units, left axis). Because monthly figures can be quite volatile, I also include a rolling 12-month (LTM) sales figure—shown as the blue dashed line on the right axis (annualized, in thousands)—to help clarify the underlying cycle.
The green line represents PACCAR’s own industry data (also right axis). This closely follows the LTM sales trend, though there’s some divergence since PACCAR uses a slightly narrower market definition. Still, the correlation between the LTM data and PACCAR’s data is an impressive 97%, underscoring how similarly they reflect industry cycles.
Where does that leave us in the current cycle? The purple dashed line shows the units per capita index (left axis), which adjusts for population growth and offers a normalized view of demand over time. I’ve also marked the median value of this index on the chart, providing a useful benchmark to gauge whether current sales are running above or below historical norms.
At present, we’re in the second year of a downturn that began in late 2023. The pandemic era saw trucking companies enjoy strong profits, which led to a mini-boom in truck sales. Now, as we wait for 2Q 2025 earnings (due out in July), it will be interesting to see how the latest round of tariffs impacts the industry. Stay tuned.
Railcar Manufacturing: Why 2025 Forecasts Are Pointing Down
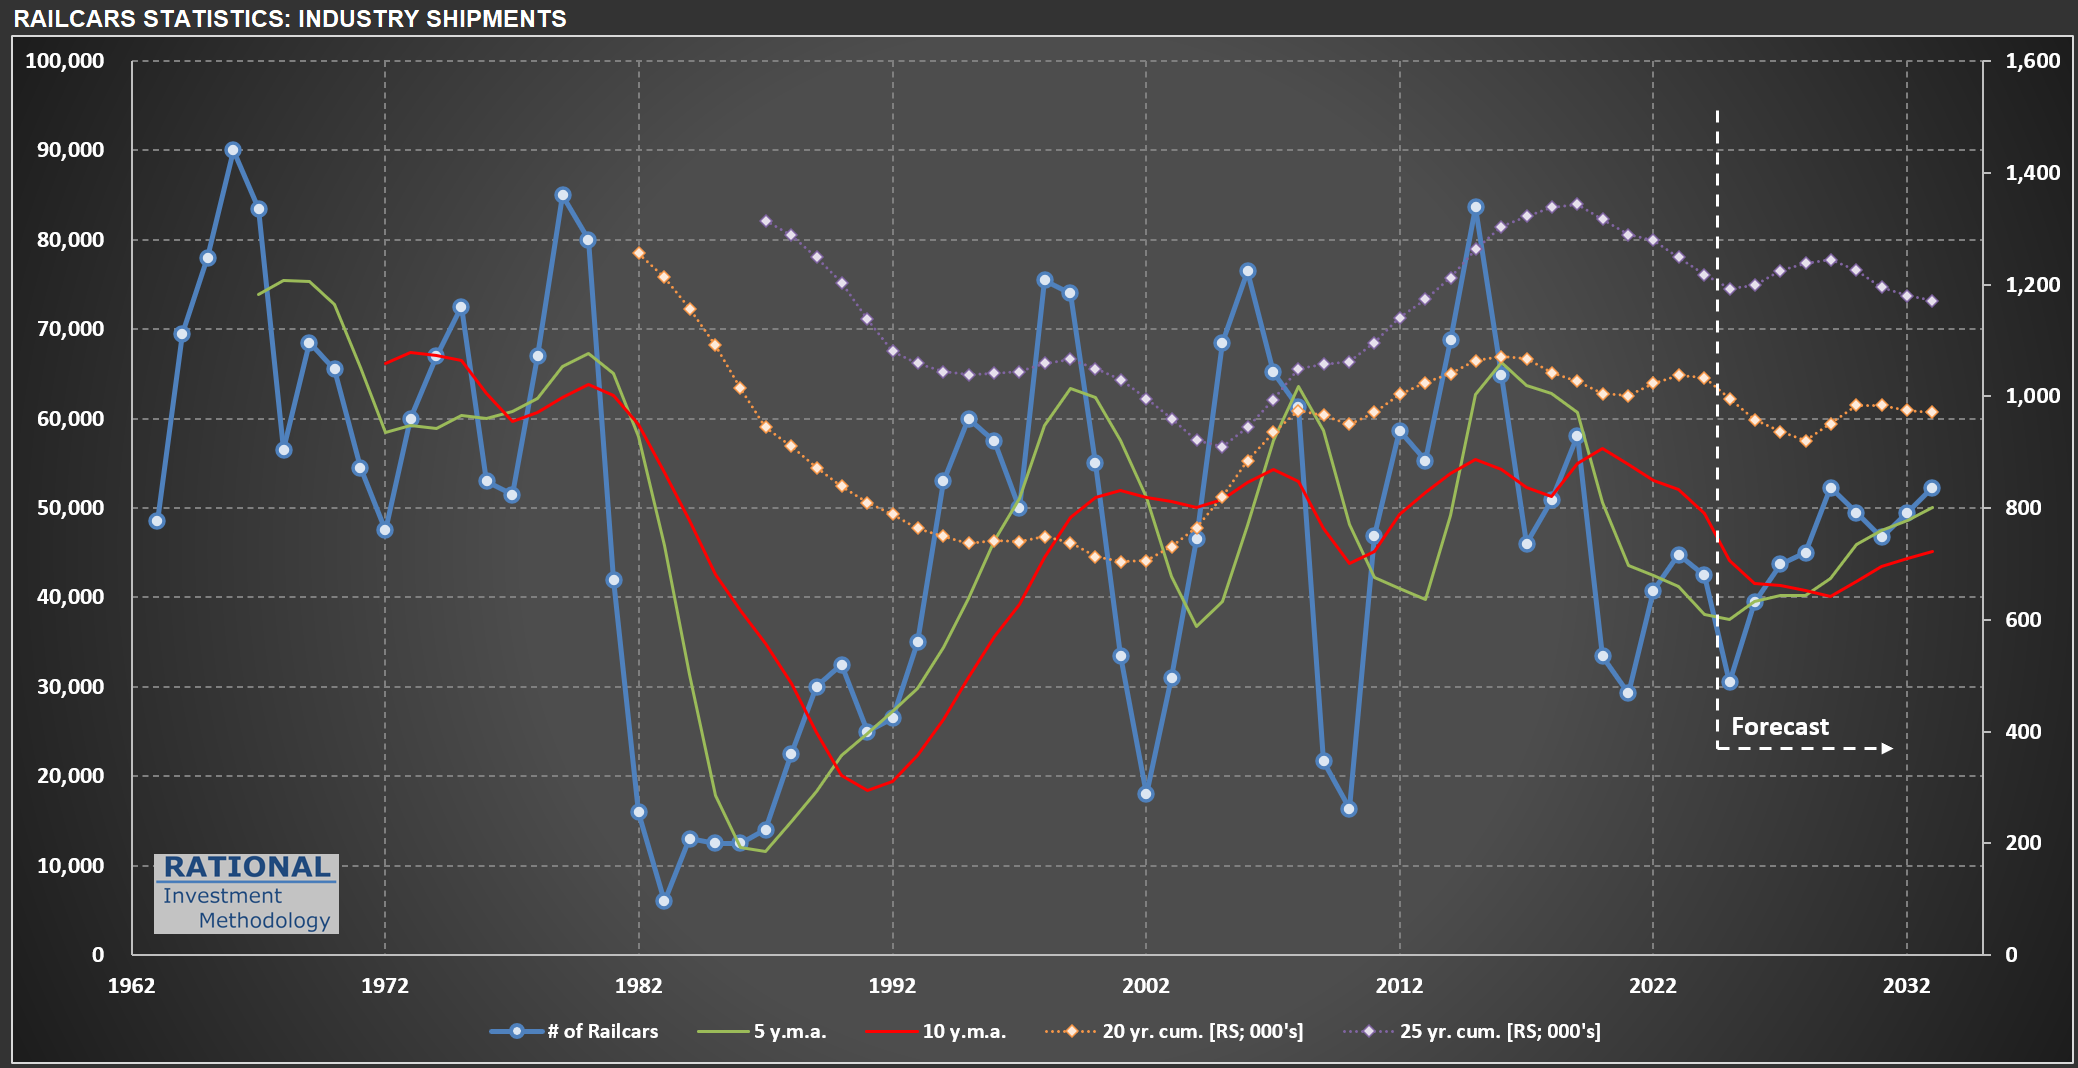
It always amazes me how volatile railcar manufacturing in the US can be. The chart below tracks railcar deliveries (blue line), with additional lines representing moving averages and cumulative deliveries over different periods. This data is from my ongoing analysis of $TRN (Trinity Industries), which manufactures, leases, and manages freight and tank railcars for sectors like agriculture, energy, construction, and consumer products.
If you look at the chart, you’ll notice that the first forecast year (2025) shows a substantial decline compared to 2024. This drop is based on the midpoint of TRN management’s guidance for 28,000 to 33,000 deliveries in 2025-a figure released on May 1, 2025, after recent tariff changes had already taken effect. For context, just a few weeks earlier-in February-Greenbrier (TRN’s main competitor) projected 38,000 industry-wide deliveries for the year.
So, why the nearly 20% drop in expected units? TRN’s management addressed this on their last conference call:
“Market uncertainty in the first quarter continued to slow conversion of inquiries to orders… Inquiry levels at the beginning of 2025 were the highest they’ve been in several years. But customers are taking longer to make capital decisions… We delivered 3,060 new railcars in the quarter and received orders for 695 railcars, evidence of the delayed investment decisions I have previously acknowledged and the lumpiness of orders quarter-to-quarter.”
This is a familiar pattern: when policymakers make abrupt changes to the rules, companies often pause before making new investments. Most CEOs and decision makers prefer to wait for clarity before committing to capital expenditures. Consumers can behave similarly. I expect to post more evidence here in the future about the noise created by the recent economic shifts we’re seeing in the US. Some of these changes may prove beneficial over time, but the probability of a short-term slowdown has clearly increased.
Watching $WAB: Rail Metrics and the Ripple Effects of Tariff Policy
I’m finishing up my update on $WAB (WabTec). The company operates in two main segments: Freight-which provides locomotives, components, and digital solutions for freight railroads-and Transit, which supplies components and services for passenger transit systems. Its core products include diesel-electric locomotives, braking systems, doors, electronics, and aftermarket rail parts. $WAB serves railroads and transit agencies worldwide.
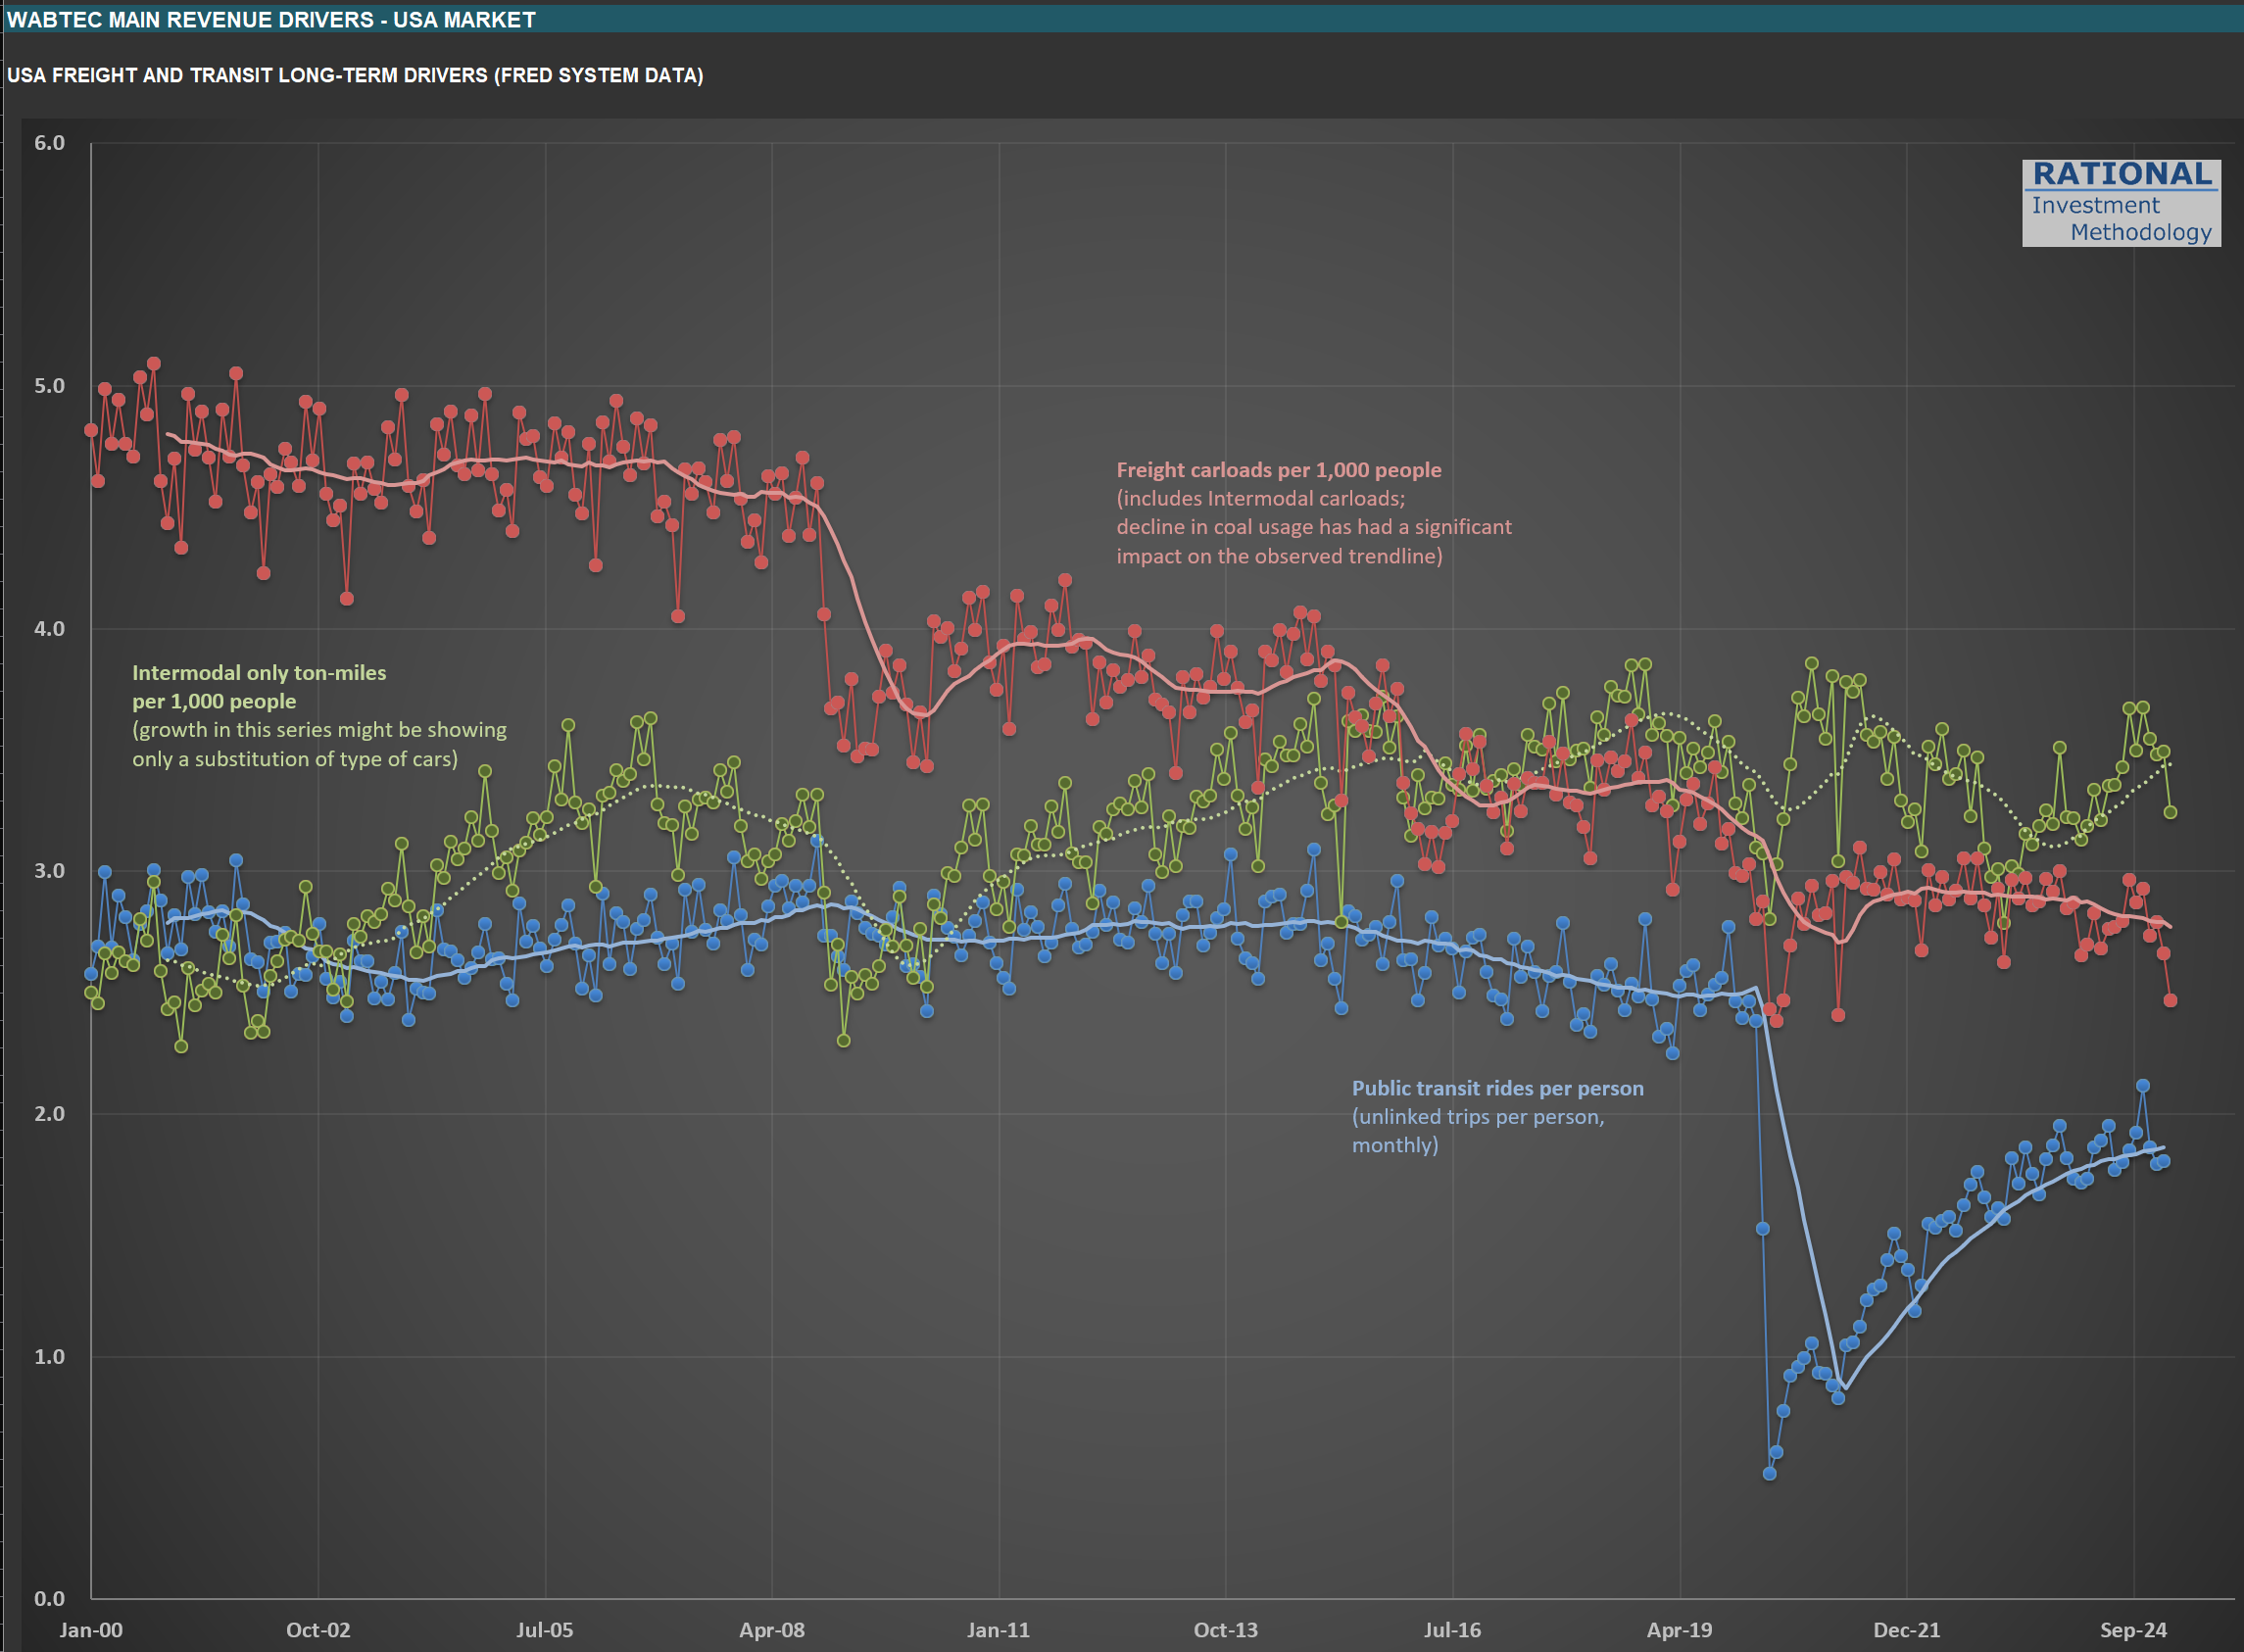
The chart below highlights three key drivers for their long-term sales:
Blue line: Public transit rides per person (unlinked trips per person, monthly). Notice that this metric still hasn’t returned to pre-pandemic levels.
Red line: Freight carloads per 1,000 people (including intermodal). The ongoing decline in coal usage has had a pronounced impact on this trend.
Green line: Intermodal-only ton-miles per 1,000 people. Much of the prior growth here reflected a shift in the type of cars used-intermodal is heavily tied to international trade.
Of these, I’ll be watching the green line most closely. It should provide a clear read on how the evolving tariff landscape is affecting rail volumes. Updating these charts is always a useful exercise, even if the monthly data arrives at a glacial pace compared to the rapid moves we see in the stock market. It’s a good reminder that the real economy moves much more slowly than prices or headlines suggest.
Gauging the Downturn: Volvo, $SAIA, $ODFL, $PCAR, and the State of US Trucking
I’ve just finished updating my analysis for Volvo (the truck manufacturer-not the car company). While Volvo isn’t American (most RIM companies are US-based, with only two exceptions), I follow it closely because it owns Mack, one of the leading truck brands in the US.
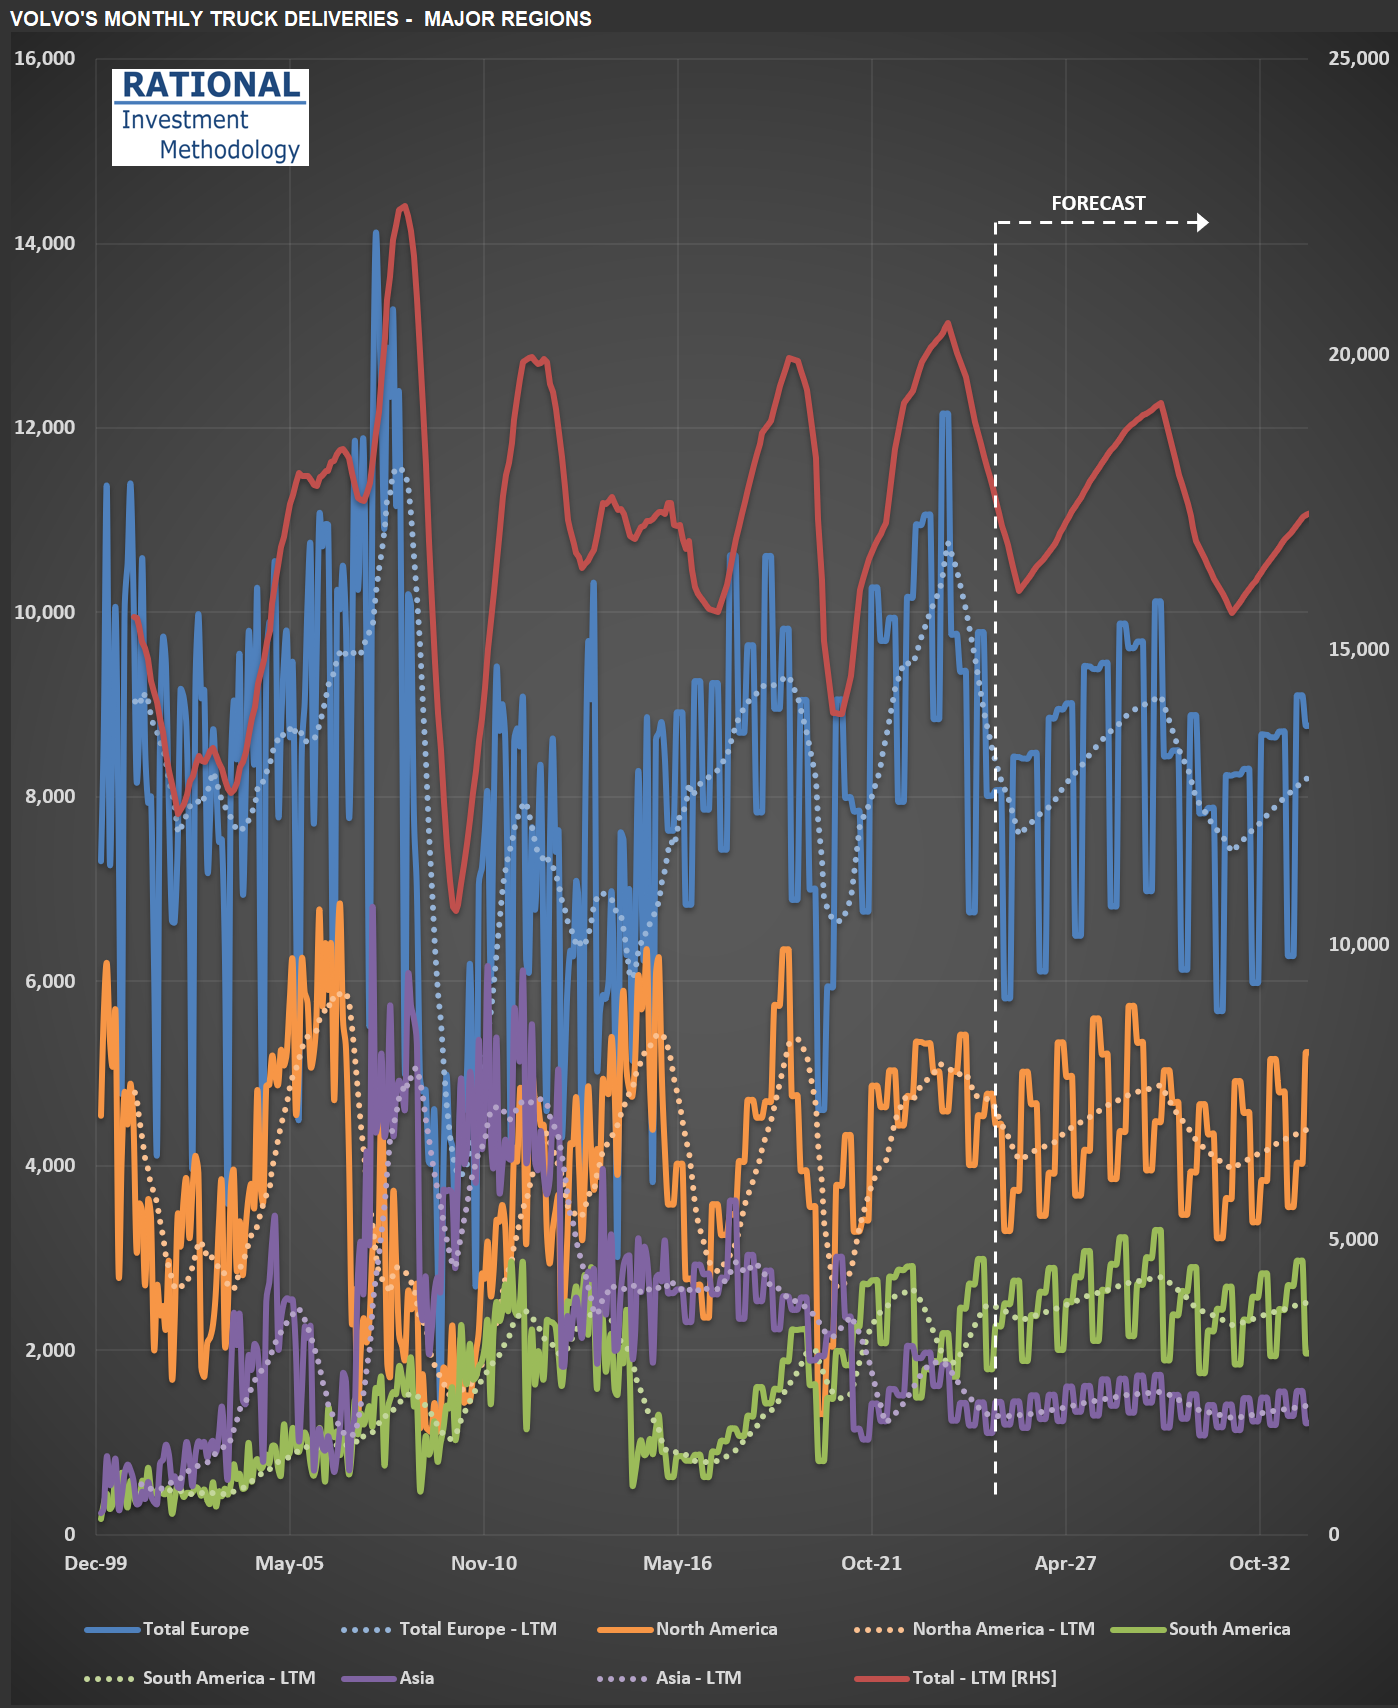
Take a look at the chart below, which shows truck deliveries across Volvo’s major regions. The first thing to note is the industry’s cyclical nature-transportation companies tend to move as a herd when it comes to ordering more (or fewer) trucks. You’ll see that we’ve been in a downturn recently (just before the vertical dotted white line). But here’s what Volvo’s CEO said during the latest conference call, just a few days ago:
“…the increased hesitation among customers in North America to place orders given uncertainty in general. We are, therefore, as we speak, adjusting production levels for group trucks North America to minimize the under-absorption in production going forward.”
In other words, the recent shake-up in economic and market conditions has made Volvo’s customers more cautious. It doesn’t help that today, shares of $SAIA (a major LTL* operator in the US and competitor to $ODFL, which is part of RIM’s CofC**) dropped more than 30% after missing earnings estimates by a wide margin.
I’ll be watching Volvo’s truck deliveries closely-they’ll provide a useful signal for how deep this current downturn might get. This will also help me calibrate my ongoing analysis of $PCAR, another major player in the US and European truck manufacturing market.
(*) LTL = Less Than Truckload (**) CofC = Circle of Competence
Tracking $EXPD Through the Global Tariff Storm
I’m working on Expeditors International of Washington, Inc. ($EXPD) today. $EXPD is a Fortune 500, non-asset-based logistics company providing highly customized global supply chain solutions—including air and ocean freight forwarding, customs brokerage, warehousing, and distribution—through a network of more than 340 offices in over 100 countries. The company employs around 18,000 people.
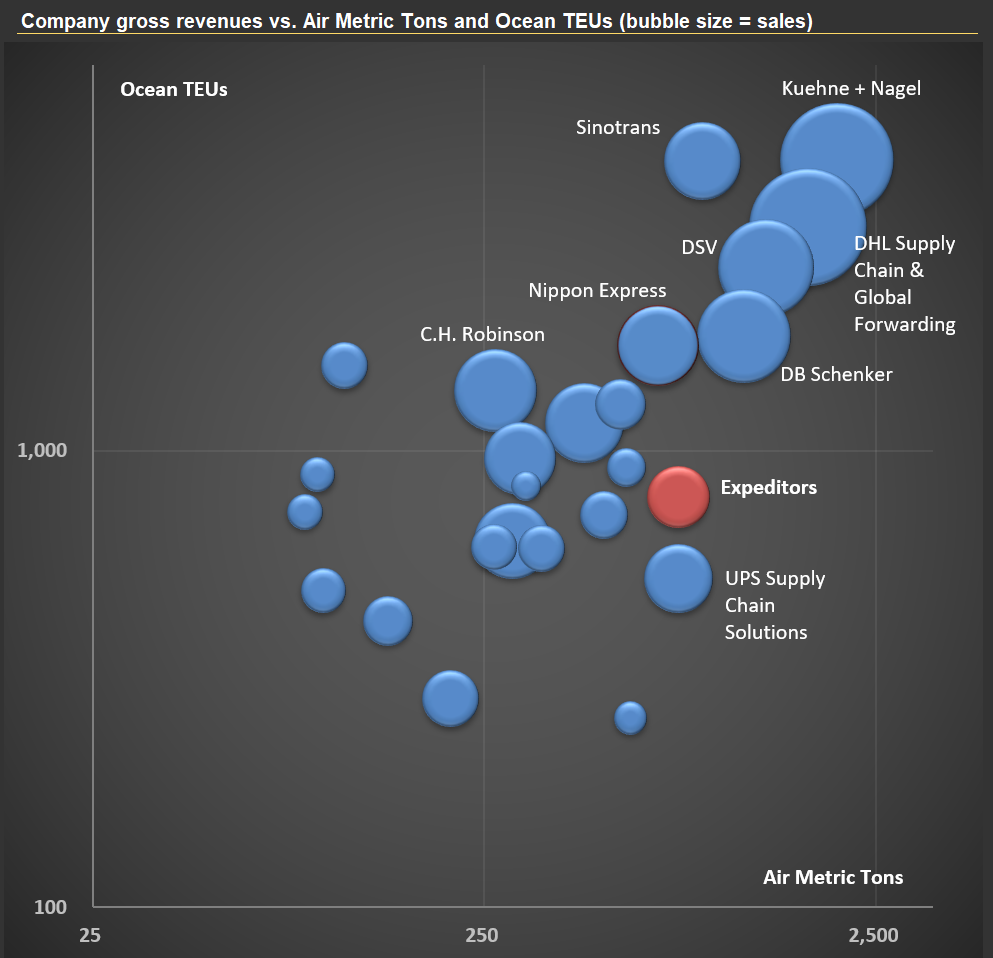
The “non-asset-based” model in logistics means that $EXPD does not own the trucks, ships, planes, or warehouses used to move and store goods. Instead, it acts as an intermediary, leveraging a broad network of third-party carriers and service partners to coordinate and manage logistics operations for clients. This approach offers flexibility and scalability, allowing $EXPD to tailor solutions, adapt quickly to changing demands, and often reduce costs by avoiding the burden of maintaining its own fleet or facilities. In the first picture below, you’ll see the top 25 players in the global logistics sector, with $EXPD highlighted in red.
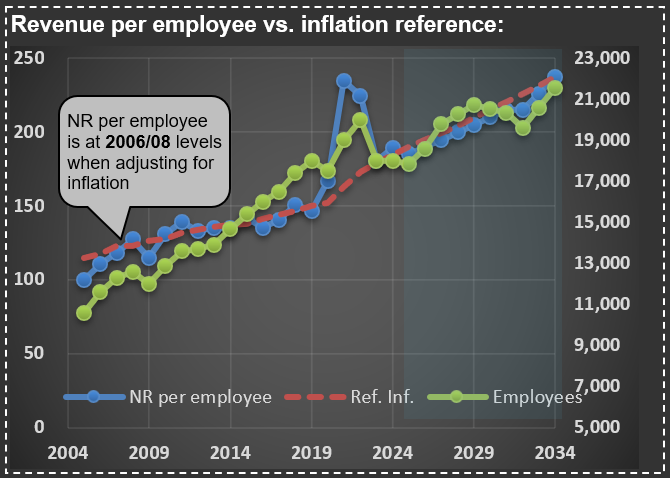
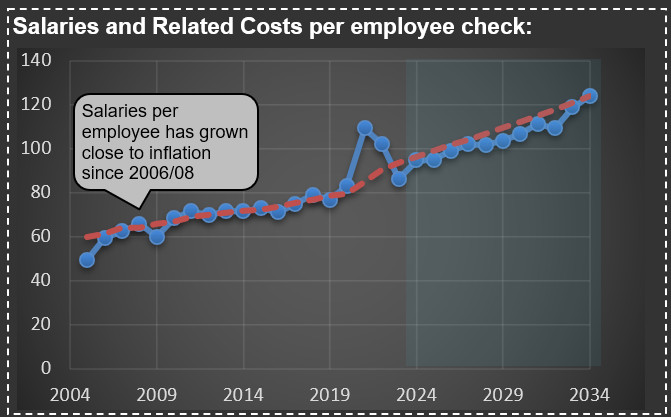
One aspect of $EXPD’s business that stands out—see the next two charts—is how little its “Net Revenue” (revenue excluding pass-through transportation costs) and employee compensation have changed in real terms over the past 20 years. Adjusted for inflation, both metrics are essentially at the same level as they were two decades ago. Intuitively, I would have expected costs per employee to decline, given the advances in computing power and process automation during this period.
The lesson: trust your intuition less, and make sure you have enough information to understand what’s actually driving a company’s revenue and costs. I’ll be watching $EXPD and its competitors closely—they’re at the center of the ongoing global tariff disputes, and their financials should eventually reflect the consequences of any shifts in the rules of the game
What's Driving PACCAR's ($PCAR) Recent Sales Slowdown?
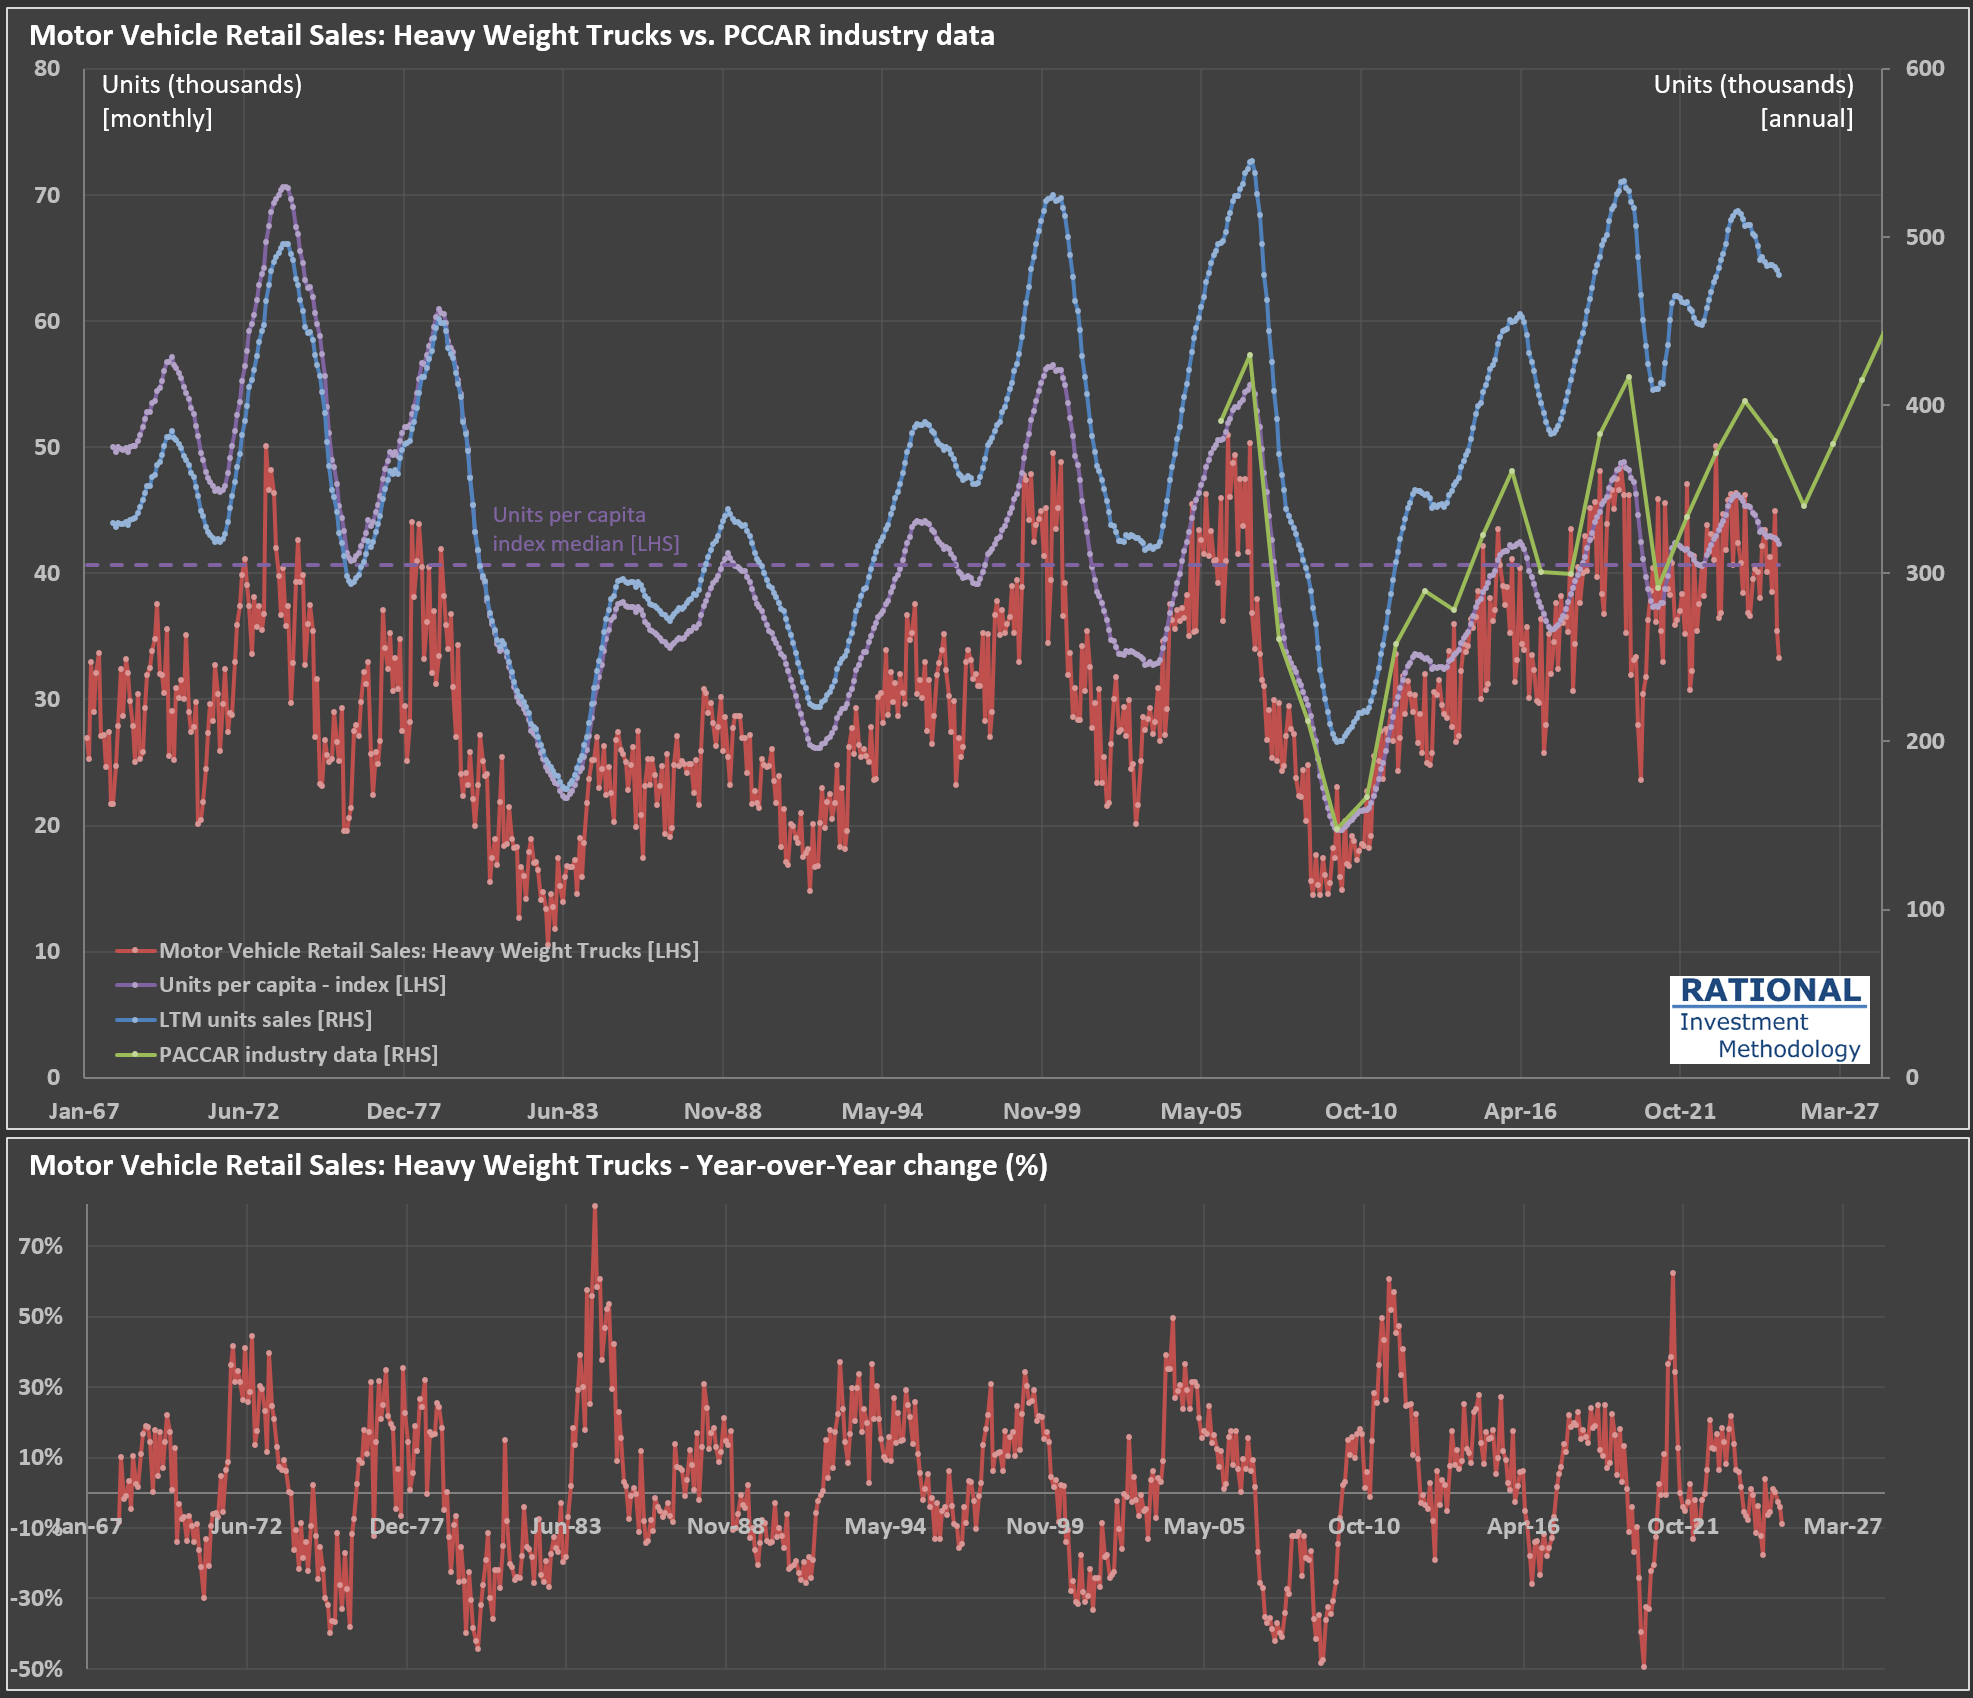
I’m analyzing $PCAR (PACCAR Inc.) today, a leading trucking manufacturer in the US and Europe. Check out the chart below—it illustrates several key data series. The red line represents monthly sales of heavy-weight trucks in the US (in thousands of units; from the U.S. Bureau of Economic Analysis via the FRED system). The blue line (scale on the right) shows cumulative truck sales over the last twelve months (LTM).
Ideally, this LTM series should closely track PACCAR’s industry sales data (green line)—they are close but not equal, as the data from the FRED system encompasses a broader category of trucks. Indeed, the correlation between these two series (blue and green) is quite high at 96%. This means we can reliably use monthly U.S. Bureau of Economic Analysis data to anticipate PACCAR’s sales trends.
Recent figures indicate a slowdown following exceptionally strong post-pandemic sales. Trucking companies earned unusually high profits during the pandemic (as discussed in my previous post here), prompting them to order trucks aggressively. With freight rates normalizing and transported volumes below trend, these companies are dialing back their purchases. Consequently, manufacturers like PACCAR are experiencing declining earnings.
Interestingly, this current cycle hasn’t been particularly severe. Notice the purple dotted line—it measures truck sales per capita in the US. Over the past decade or so, sales cycles have become relatively muted, even when factoring in pandemic-related volatility (the bottom chart shows year-over-year changes clearly). Imagine how challenging it must be for manufacturers to manage operations amid such fluctuations.
Understanding Transportation Trends Through Cass Index Charts
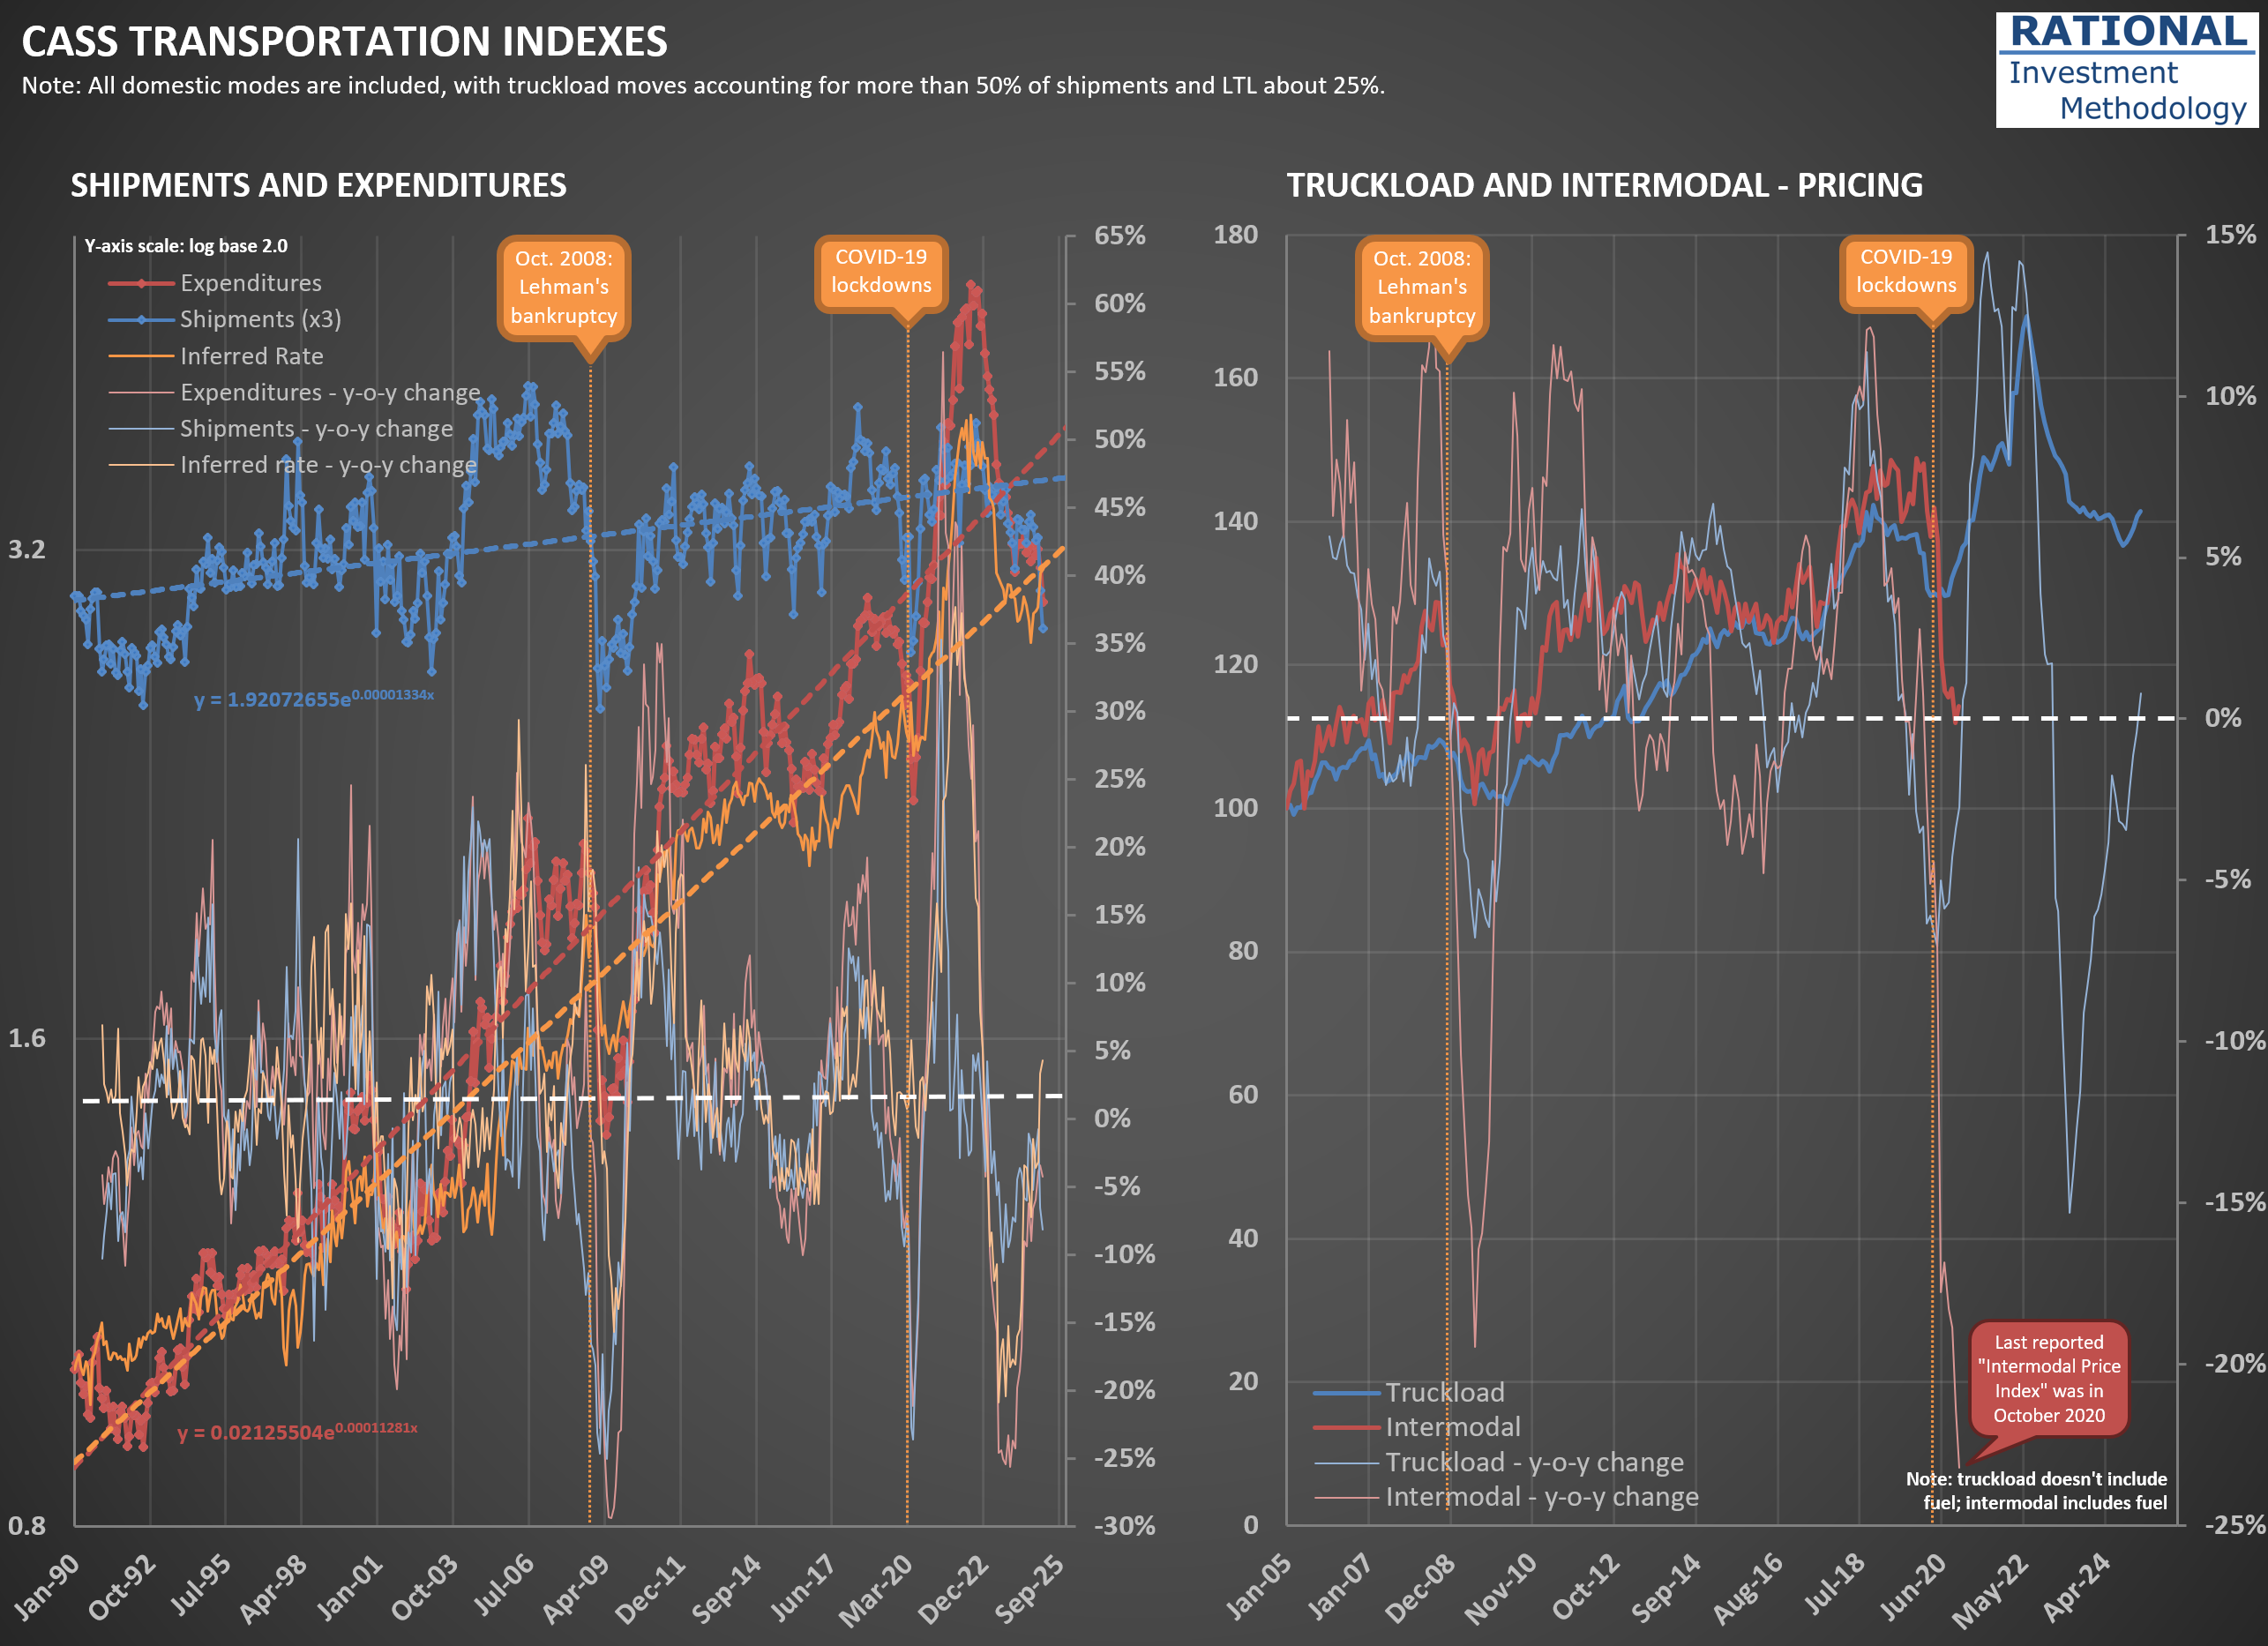
I’m writing a Portfolio Action [PA] to RIM’s clients and referencing the chart below. I’m posting it here so my clients can see a more complete explanation of the Cass Transportation Indexes and—if on a computer—zoom in on the chart itself. As always, here is a disclaimer: the charts I share with you are for my professional use. I share them “as is” because I want you to know what I do daily. Therefore, they are not “presentation ready” charts. They are busy, with a lot of lines. However, they serve their purpose well: quickly displaying information (lots of it) to me. So take the time to analyze the charts I’m sharing with you, so you can absorb all the information they portray.
Let’s go to the charts themselves. On the left, the most crucial series are the shipments (dark blue) and expenses (dark red). The series covers all modes of domestic transportation, but truckload shipments account for more than 50% of the index. LTL (Less Than Truckload) is close to 25%. So, this is mostly a trucking-related index.
Note that “expenses” in this context means how much the user of trucking services paid trucking companies for their services. In other words, expenses equal revenue to trucking companies. Also note that these two series are on a log scale base 2. Why a log scale? Because the series is so old, you would be unable to see variations in the distant past (as older values - especially for the expense series - are much smaller than newer ones).
I also added to the charts a reference to two important events: the month Lehman Brothers went bankrupt, significantly exacerbating the economic downturn in 2008, and the lockdowns in March 2020. Also note that both series have a dashed line crossing them—they are exponential trendlines (which in a log scale appear as a straight line). They help gauge where we are in a cycle.
For instance, observe how much expenses were over its trendline during the pandemic, while shipments - albeit above the trendline - had a much smaller peak. This is because shippers were willing to pay a lot to secure transportation capacity due to the abnormal consumption triggered by excessive government stimulus. Observe how the light-orange line - showing a year-over-year [y-o-y] delta in the inferred rates charged - had its most significant spike ever during the pandemic.
Last, the light-red and light-blue lines show y-o-y changes in the shipments and expenses series. Note how both have been in negative territory for a while. In January 2025, they completed 24 months of continuous decline, the most prolonged period since the series started in 1990. A few crises got close, but none reached the 2-year mark. That is why trucking company CEOs say we are in a “freight recession.”
The chart on the right shows a couple of series trying to isolate prices for (i) truckload and (ii) intermodal. They will show cycles similar to those in the series on the left. However, Cass claimed they had difficulty measuring intermodal prices during the pandemic and interrupted the series' release. I hope one day they return to reporting it.
The Cass Transportation Indexes are a fantastic source of insights on the transportation industry. To complement it, I also like to see what the American Trucking Association [ATA] data tells us. You should check the post I made a few days ago using the ATA data (here).
What Trucking Tonnage Tells Us About Market Crashes and Recessions
I was recently asked if a market crash can trigger a recession. In short: yes, it certainly can—and it did in the early 2000s.
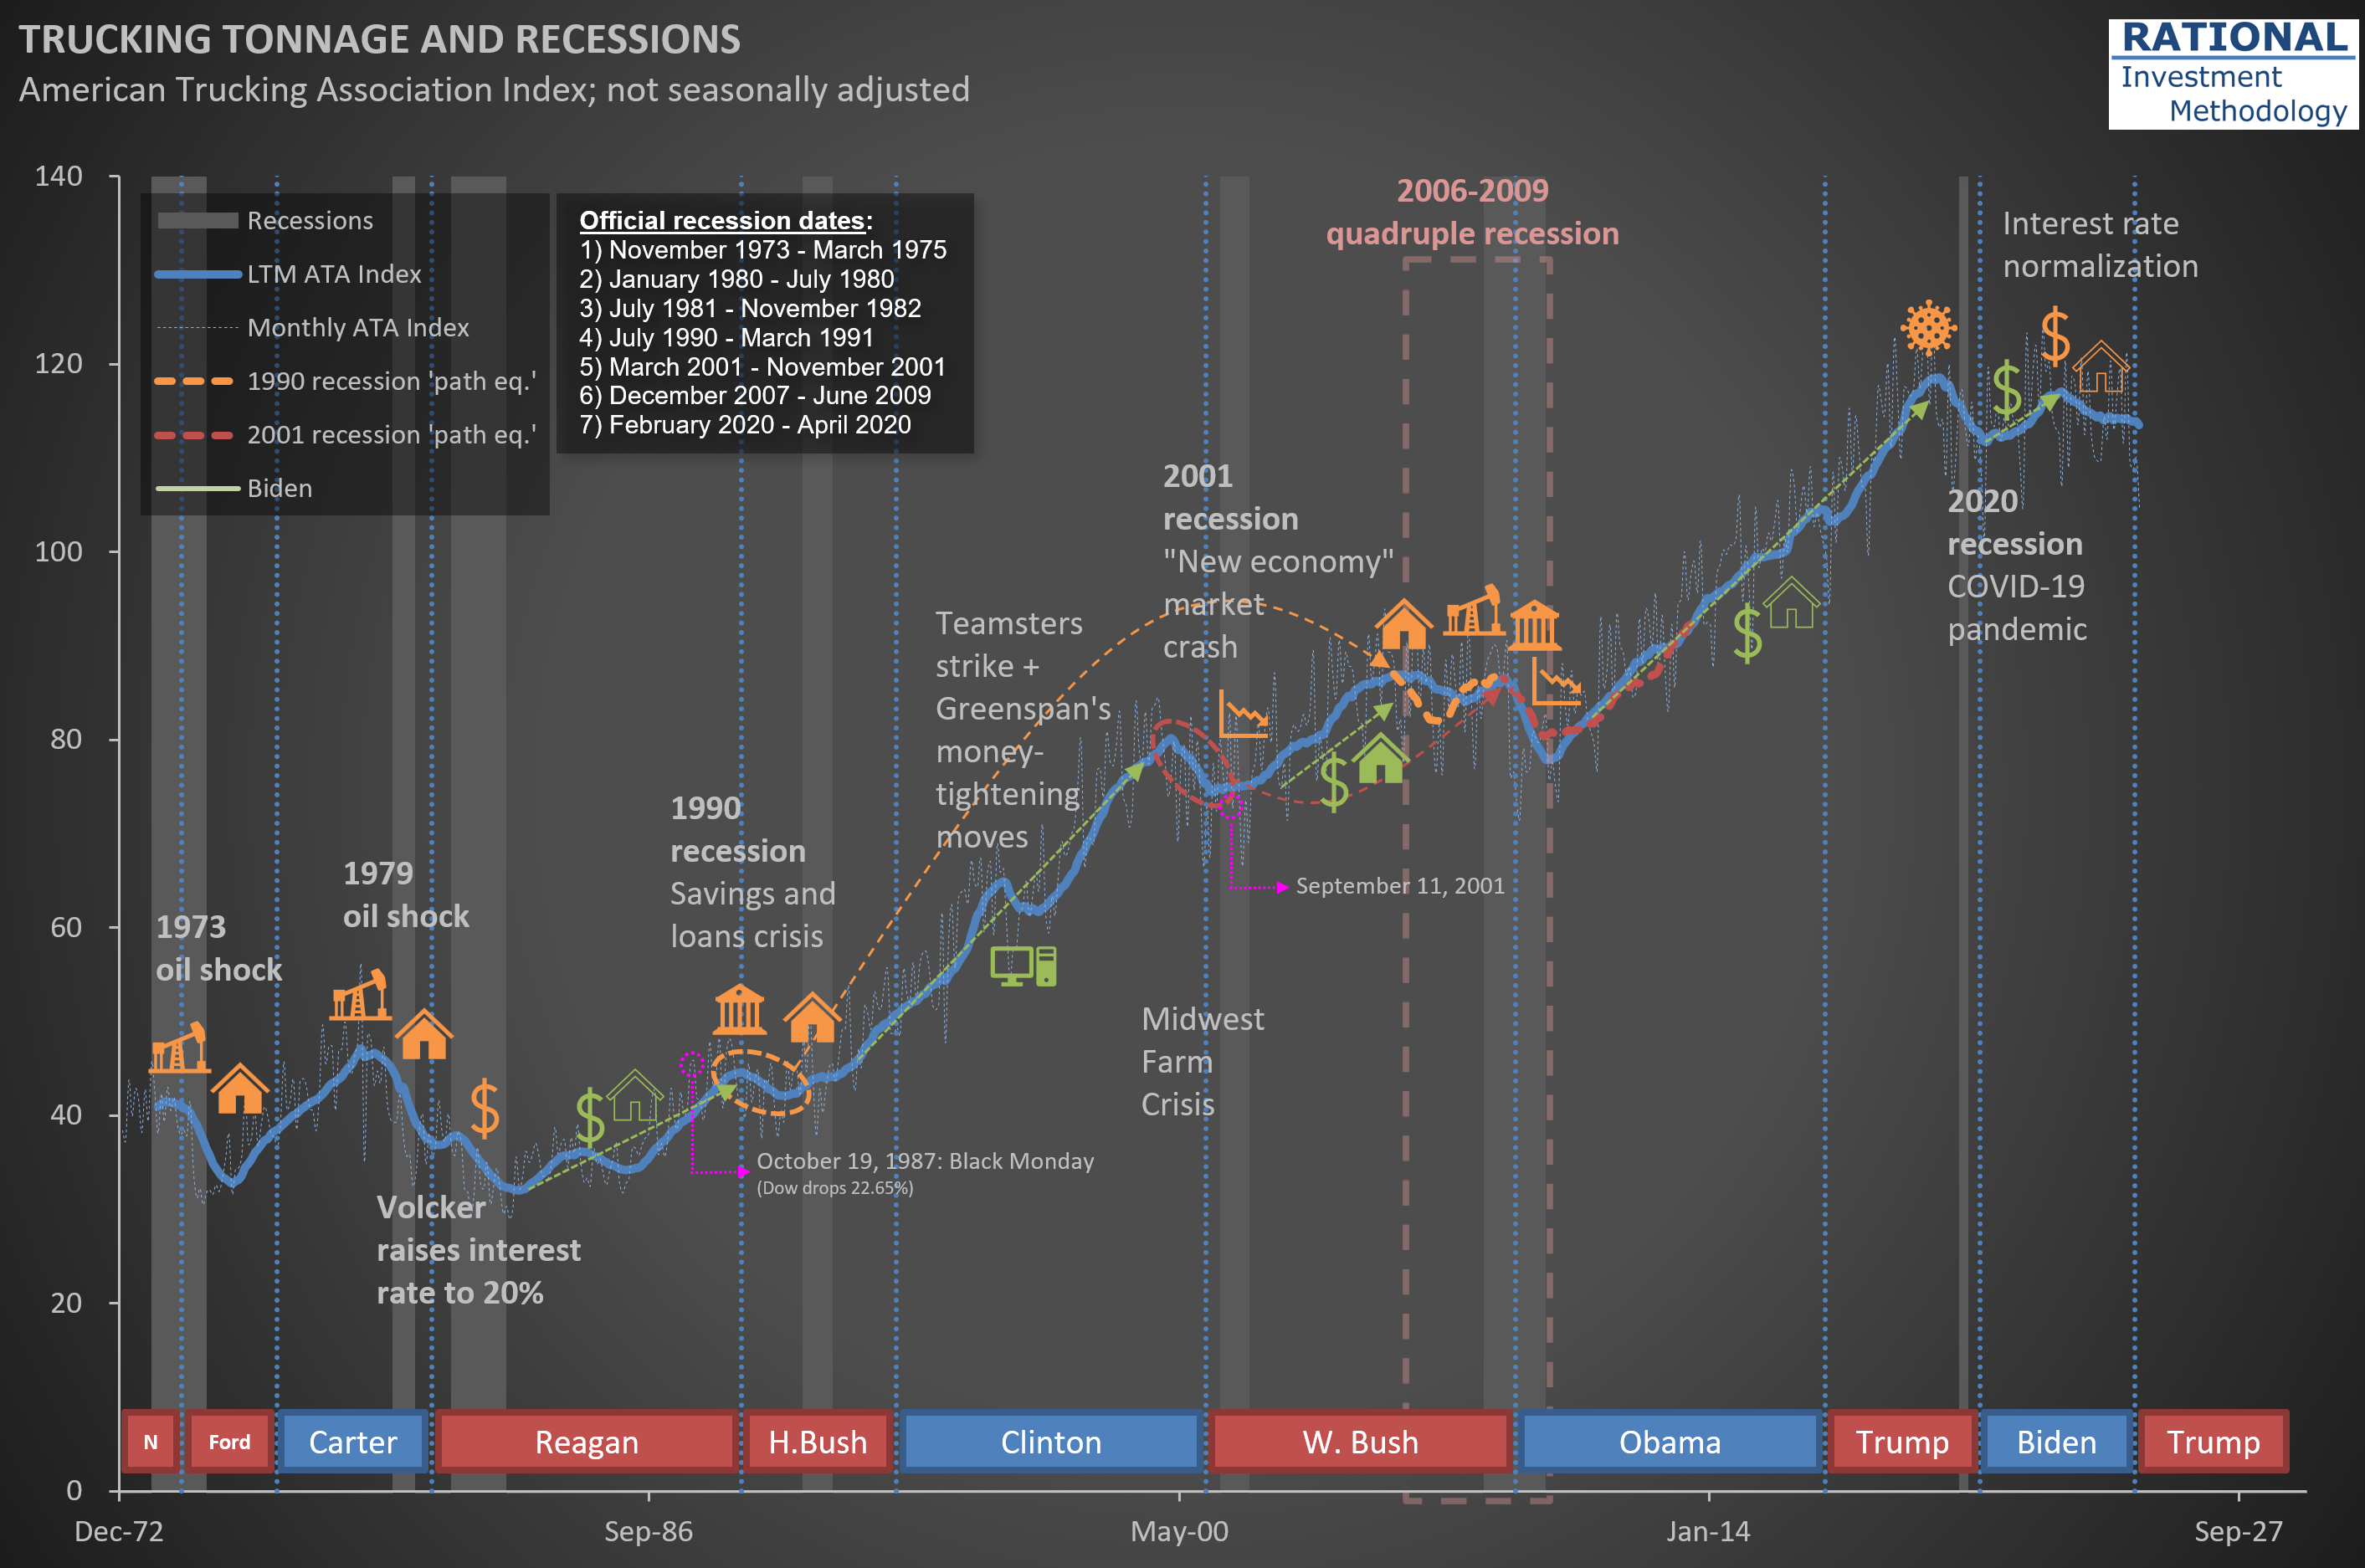
The chart below should look familiar to RIM’s clients. It shows trucking tonnage data from the ATA (American Trucking Association). The thin-dotted blue line represents monthly figures, which tend to be volatile due to weather seasons and holidays. I’ve added a thick blue line showing the Last Twelve Months (LTM) moving average to better identify trends.
Every turn in this LTM line has a story behind it—economies typically grow until something disrupts them. That’s why you’ll see annotations on the chart marking significant events: sharp oil price spikes, declines in housing starts, rising interest rates, banking crises, market crashes, and even a global pandemic (I never imagined I’d be adding that one!).
Take a closer look at the early 2000s. Trucking tonnage began declining around March 2000—exactly 25 years ago—coinciding with the internet bubble bursting. While the tragic events of September 11th certainly disrupted economic activity further, the downturn had already begun well before then. However, the market crash was clearly the initial trigger.
Could we be experiencing something similar today? Nobody knows, but there’s no point obsessing over it. Unless, of course, you invest in companies for which it is challenging—if not impossible—to predict long-term sales and profitability. These types of companies are the core protagonists—in terms of how much they decline—during bubble bursting years.
As equity investors, our focus should remain on thoroughly understanding a select group of companies and accurately modeling their financials based on company- and industry-specific data. Then, when the market inevitably overreacts to short-term news or temporary EPS fluctuations, we’re ready to act decisively. If you’ve been following RIM’s approach, you know that’s exactly what I do every single day.
Less cars but higher sales in real terms? Inflation confusion at play
After finishing my $AAP (Advance Auto Parts) work, I’m updating my analysis on $ORLY (O’Reilly Automotive). The difference in performance between these two stocks is staggering, but—given current price levels—you might be surprised which offers materially better prospects for higher IRRs (Internal Rate of Return) for the long-term holder.
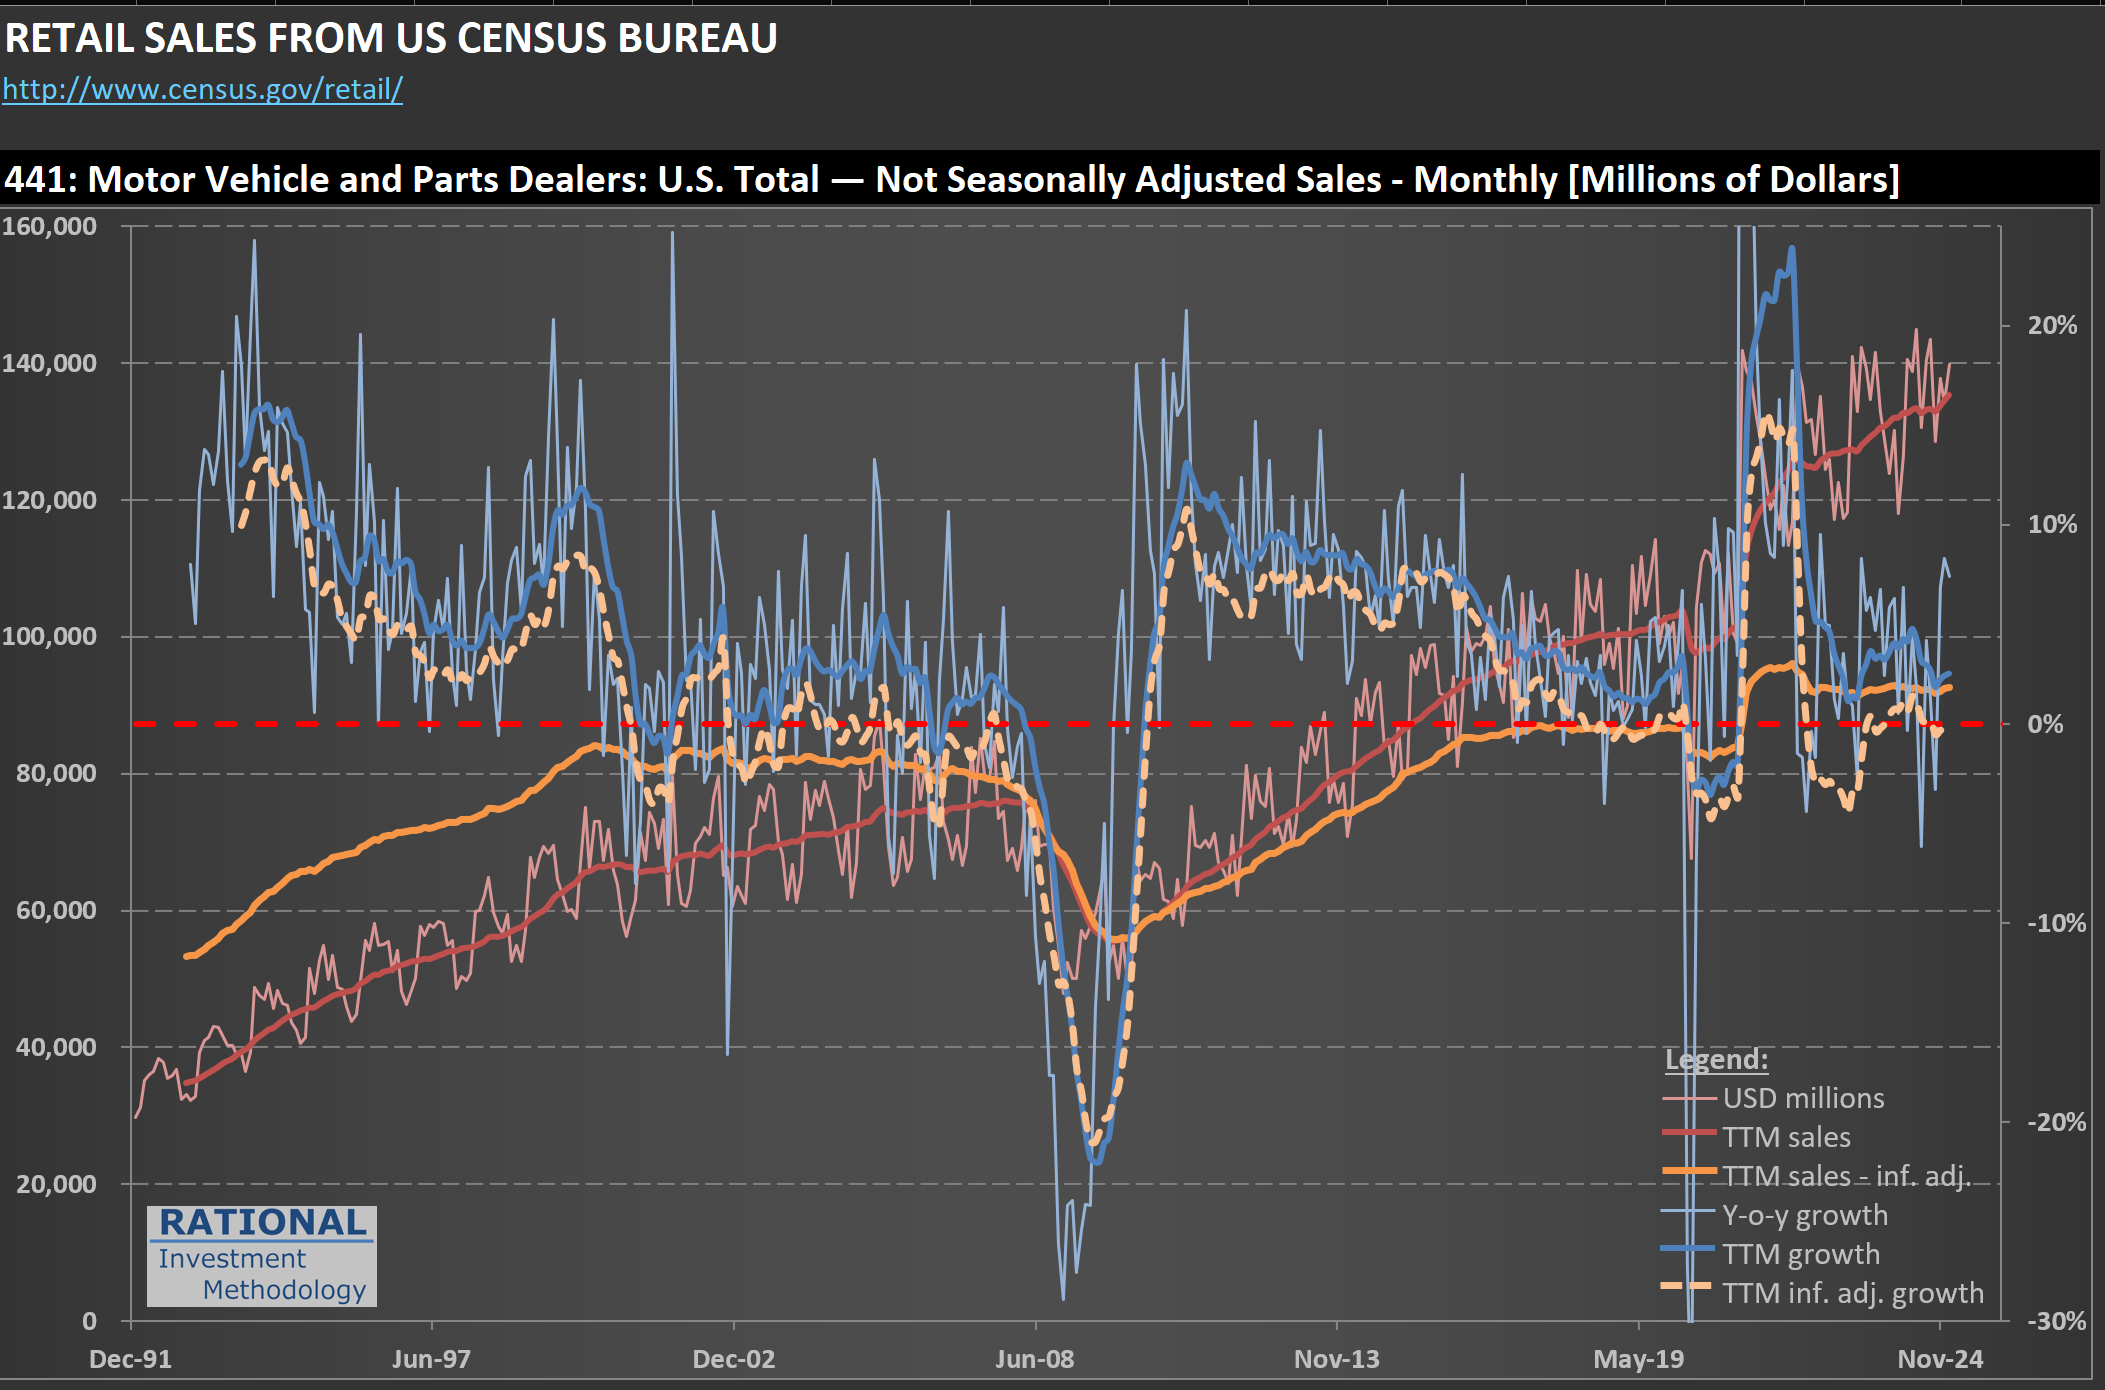
The chart I’m sharing below offers a high-level view of motor vehicle (and parts—a small part of these figures) sales. The line to focus on is the orange one: it shows sales adjusted for inflation. Now if you look at the last post (here) showing the number of vehicle sales, you will see a discrepancy. I.e., the number of vehicle sales is lower (by -7,5%) while the total dollars spent is higher (by +6.4%) compared to pre-pandemic levels.
A change in mix (more expensive cars, less cheap cars) could explain part of the delta. But another factor is at play: the overall inflation ratio (which I use to normalize sales) doesn’t capture the actual inflation in car prices. These more expensive (in real terms) cars lead to lower unit sales than before. It doesn’t help that the American consumer is also in a recession - I discussed it on a post yesterday (here).
Understanding long-term drivers for auto parts sales
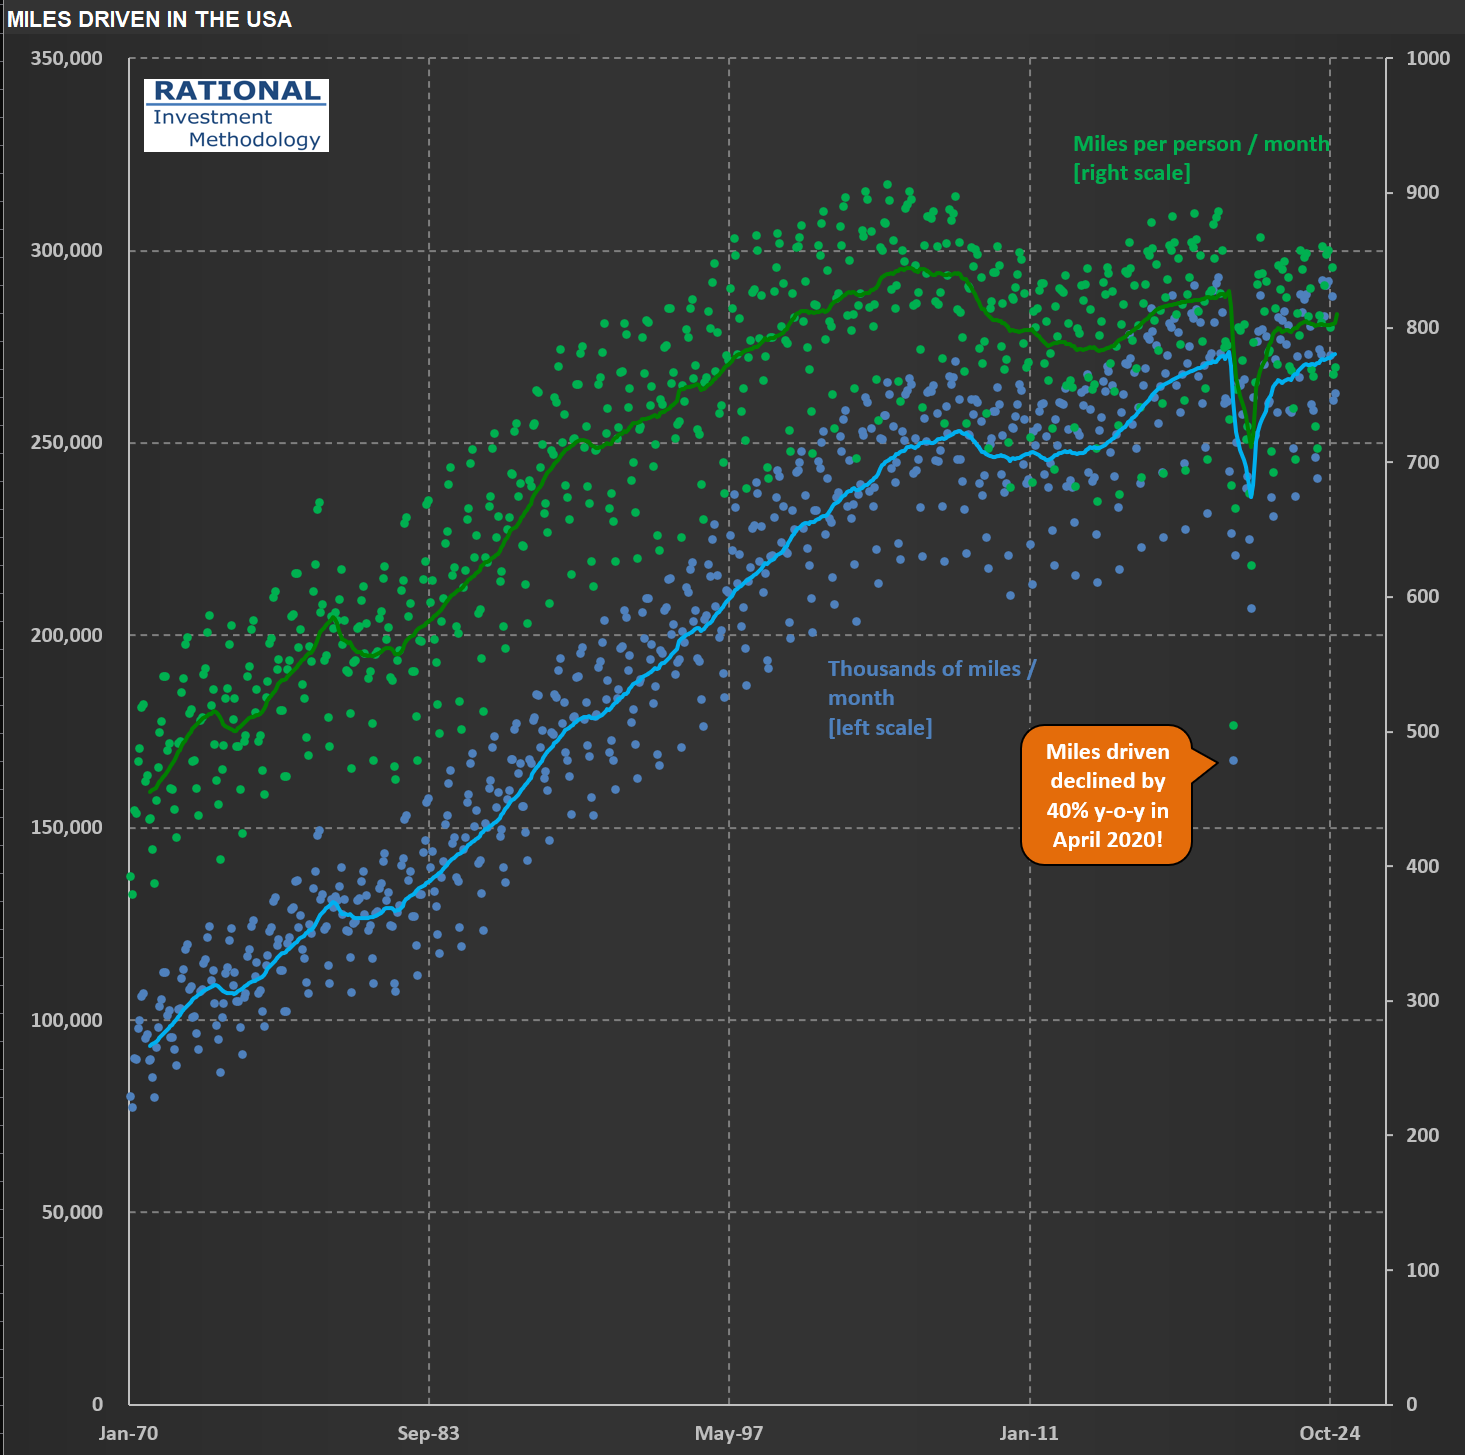
I’m working on $AAP (Advance Auto Parts) today, one of the top three auto parts retailers - more on the business later. Now I’m sharing two charts I have in my analysis to ensure I’m aware of some secular trends affecting the industry.
The first shows total miles driven (in blue) and miles driven per person (in green). The lines are a trailing 12-month figure. Total miles driven still grows, but not by much. It is interesting to note, however, that miles driven per person peaked in 2005—two decades ago!
If people drive less, they should be buying fewer cars—at least per capita, right? We observe this in the data—see the second chart. The blue dots show cars sold per month. In red, an index of how many cars were bought per capita is shown. The peak of car purchases in the US happened in the summer of 1979! The last peak of absolute numbers of vehicles sold in 12 months happened 25 years ago, in the summer of 2000.
These figures help me calibrate the underlying potential auto parts sales. On top of the drivers I just shared, I still need to consider how long cars last nowadays. For example, if one observes that we have an “aging fleet” in the US and concludes that they are going to need more auto parts, that might not be the case if cars just last longer. Technology has made parts more durable. Hence you have to consider a cascade of effects when trying to understand what will impact sales in the long run.

Trucking Tonnage Trends: What ATA Data Reveals About Economic Momentum
Trucking tonnage data from the American Trucking Association (ATA) reveals a persistent sluggishness in demand for trucking services. Take a look at the long-term perspective in the chart below, which helps contextualize current industry conditions within historical patterns.
The visualization offers valuable insights into freight movement trends—often considered a bellwether for broader economic activity. For those monitoring economic signals, this data point merits attention alongside other indicators when evaluating the current business cycle position.
